Curated OER
Slope of Line
In this algebra worksheet, students calculate the slope of a line. They graph a linear equation given the slope and y-intercept and identify the slope and y-intercept given a linear graph. There are 15 questions.
Curated OER
Do the Elephants Need Sunscreen? A Study of the Weather Patterns in Etosha
Students analyze the weather patterns in Namibia. They create a graph of the yearly temperatures and use the internet to gather information. They discuss how the weather goes in cycles in the area.
Curated OER
Data Scavenger Hunt
Eighth graders discuss how data is collected and participate in data collection through a survey. They complete a scavenger hunt on the Internet to gain understanding of the data measures mean, median, mode, and range.
Curated OER
Tessellations
Students learn and review basic geometric terms, definitions, and theory, including regular polygons, lines, angles, points, etc. They make a tessellating stamp and create a repeating work of art.
Curated OER
Grade 5: Testing for Tessellations
Fifth graders use formal geometric language to describe polygons (and other shapes) that will tessellate the plane and those that will not. Students make generalizations about the characteristics of a polygon (or other shape) that will...
Curated OER
Chessboard Series
High schoolers work together on a word problem. They write a written report of the answer. They participate in a chessgame in which the answers are used.
PBS
Toothpicks and Transformations
High schoolers investigate quadratic functions using geometric toothpick designs. They review transformations of quadratic functions-vertical and horizontal shifts, and stretches and shrinks. Students match the symbolic form of the...
Curated OER
Michigan Virtual Field Trip
Students analyze data from a virtual field trip to Michigan. They conduct Internet research on mileage and travel time between cities, calculate and compare fuel costs, and research and calculate lodging, activities, and meal costs.
Curated OER
What is a Tangram?
Students identify a tangram. In this geometry lesson, students read Grandfather Tang's Story and retell each story using the tangrams on a flannel board. Students use tangrams to complete an included worksheet.
Curated OER
Rise Over Run
Students define the slope of the line, find the slope between any two points on the line, and allow them to name other areas where the slope is used. They explain why the slope is defined as the rise over the run.
Curated OER
Fraction Puzzle Problems
Fifth graders design a fraction word problem PowerPoint presentation. In small groups they complete a storyboard graphic organizer for their word problem, evaluate another group's word problem, and create a PowerPoint presentation of...
Curated OER
Spending Plans
Students explore the concept of dividing their money into categories, namely "save," "spend," and "share." They engage in activities that help them explain that money is limited in quantity and must be divided for different purposes.
Curated OER
The Demographics of Immigration: Using United States Census Data
Students work together to analyze United States Census data on immigration. They compare and contrast the data and determine how immigration numbers have changed over time. They calculate percentages and make their own conclusions...
Curated OER
Graphing and the Coordinate Plane
Students examine the four quadrants of Cartesian coordinate plane. They play maze games and coordinate games to discover how to read and plot points on the plane. Students plot points on the coordinate plane and examine the ratio of...
Curated OER
Introduction to Functions
Students explore functions, function rules, and data tables. They explore terms of linear functions. Students use computers to analyze the functions. Students write short sentences to explain data tables and simple algebraic expressions.
Curated OER
The Study of Urban and Suburban Environments within the Mystic River Watershed
High school students examine their own water-based environments, within the Mystic Watershed. As the learners engage in inquiry-based, hands-on projects, critical thinking skills and problem-solving, the project will lead them to cross...
Curated OER
Wheels for Jack and Jill
Learners design, make and appraise a model wheeled vehicle that is capable of carrying a small load. This activity is part of the unit `Wheels in motion'.
Curated OER
Building Shapes From Numbers
Students experience how to illustrate some of the many connections between number and geometry. Through this 2-3 day focus on square numbers and triangular numbers, students make connections among mathematical topics.
Curated OER
Teaching Polygons using Technology
Third graders utilize different types of computer programs, such as Microsoft paint and Microsoft Word to study and create different types of polygons. They use PowerPoint to create a story about a shape and others that it meets during a...
Curated OER
Pyramids and Prisms: Guler's Formula
Sixth graders detect and categorize the attributes of geometric shapes to solve problems. In this geometry lesson, 6th graders construct a variety of polyhedra. Students recognize the relationships between two dimensional and three...
Curated OER
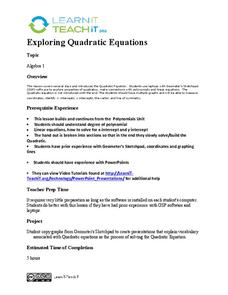
Exploring Quadratic Equations
Eleventh graders explore quadratic equations. In this Algebra II lesson, 11th graders use Geometer’s Sketchpad to explore the properties of quadratics and the connections with polynomials and linear equations. The lesson is...
Curated OER
Comparing Data on Graph A and Graph B
Second graders gather and graph data. In this graphing lesson, 2nd graders collect data and graph this information using tally charts, bar graphs, pictographs, or tables. They make predictions about the outcomes.
Curated OER
Using Excel To Teach Probability And Graphing
Students engage in the use of technology to investigate the mathematical concepts of probability and graphing. They use the skills of predicting an outcome to come up with reasonable possibilities. Students also practice using a...
Curated OER
Using Excel to Reference and Graph Live Data from a Web Site
Middle schoolers collect live buoy data about water temperatures in the Gulf of Mexico from the Internet and work individually to organize their data and create a line graph using Excel Spreadsheet. Students analyze their data and...


