Curated OER
Pictographs
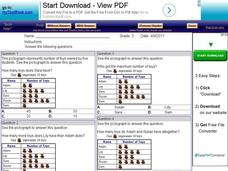
In this pictographs worksheet, 7th graders solve 6 different problems related to the pictograph shown at the top of the sheet. First, they pretend that they counted birds and their numbers are represented in the pictograph. Then,...
Curated OER
Hats for Sale
What type of hat do you think sells the best? Elementary learners will use the picture graph provided to answer the comprehension questions. A chart accompanies the picture graph, so youngsters can see the data multiple ways.
Curated OER
Shooting Stars Pictograph
In this pictograph worksheet, students use a given graph to answer a set of 5 questions. A website reference for additional resources is given.
Curated OER
Sunshine Math- 2 Earth, IV
For this math problem solving worksheet, students complete 6 problems that include: pictographs, reasoning, basic operations, and money.
Curated OER
Sunshine Math- 5 Saturn, III
In this problem solving worksheet, students complete 8 varied problems that include: money, pictographs, fractions, symmetry and basic operations.
Curated OER
Using Pictographs With Data
In this using pictographs with data worksheet, 3rd graders read data from a pictograph to answer ten multiple choice questions. Answers can be shown on the screen.
Curated OER
Interpreting a Pictogram
In this pictogram worksheet, students interpret a pictograph on ladybirds and answer 5 short answer questions or drawings referring back to the pictogram. Students carry out their own scenario pictogram and draw a table with their results.
Fuel the Brain
Interpret Pictographs
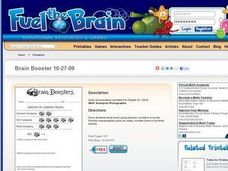
Have your youngsters use a graphic organizer and key to solve the following questions. By learning to interpret the pictographs, they will solve the problems accurately.
Curated OER
Picturing Hats
In this pictographs worksheet, students examine a pictograph then solve 11 problems related to the data in the pictograph. Students cross out problems that do not relate to the pictograph.
Curated OER
Practice Dividing by 2, 5, or 10
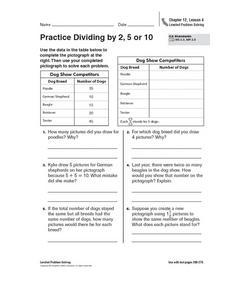
In this pictograph problem solving worksheet, students analyze the data on a table and create a pictograph. Students read and solve 6 story problems about the pictograph.
Curated OER
Fractional Parts of a Group
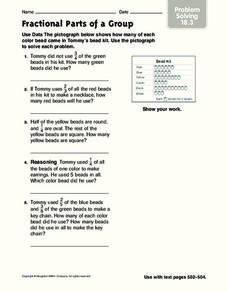
In this problem solving activity, students problems solve the answers to 5 mathematical word problems involving fractional parts. Students use data from a pictograph to assist them in solving each word problem.
Curated OER
Favorite Pet
In this math activity, 2nd graders study the pictograph of favorite pets. Students then answer nine questions pertaining to the given graph.
Curated OER
Where Did the Bunny Leave the Eggs? Picture Graphing Activity
The Easter Bunny left us a bunch of eggs, but how many did he leave? Learners use the data to create a picture graph, interpret it, and answer the questions that follow. There's even easy egg cut-outs for your youngsters!
Curated OER
Graphs
For beginners to picture graphs this is the perfect resource. They analyze two bar graphs that break down data visually so scholars can actually count the number in each column. For the first, they fill in how many of each type of pet is...
Curated OER
What's Your Favorite Fruit?
A sweet activity to challenge your first graders! The picture graph displays a class's favorite fruits. Young learners solve various problems with the data, including counting the amounts of each kind of fruit, and interpreting which...
Curated OER
Math--Pictures and Bars--Learning About Graphs
What is a graph? What does it tell us? How do you make one? These are all questions that are answered in the included packet. It's a great introduction to graphing for young learners!
Curated OER
Data Handling: Pictogram of Birds
In this pictograph problem solving worksheet, students analyze a pictograph of birds seen each day for a week. They use the information on the graph to solve 6 problems.
Curated OER
Choose a Graph to Display Data
In this math graphs worksheet, students write line plot, tally chart, pictograph, or bar graph to tell the best kind of graph to use to answer the six questions.
Curated OER
Flower Comparison Activity
Elementary schoolers write equations for comparisons and make a pictograph based on their comparison. Answers included on page 2.
Curated OER
Easter Egg Pictograph
In this pictograph worksheet, students use a given graph to answer questions about Easter eggs found by children and answer related questions. A website reference for additional resources is given.
Curated OER
Sunshine Math-1
In this math skills worksheet, students answer 7 questions in which they use various basic math skills. They use number lines, charts, number blocks, a calendar and a ruler to complete this worksheet.
Curated OER
Use a Graph
Information is often presented in graph form. Can your youngsters read a basic bar or picture graph? Six word problems accompany three graphs. One graph is a bar graph and the other two are pictographs.
Curated OER
Picture Graphs
An innovative way to practice reading data, as well as the four operations! Three picture graphs prompt first graders to count marbles, books, and pets. They also solve addition and subtraction problems. Additionally, they work on...
Curated OER
Bird Pictogram Page 2
In this math worksheet, students examine a pictogram which shows the 4 most common foods of wild birds. Students analyze the pictogram and answer 8 questions about the data displayed.


