Curated OER
Picture Graphs
Are your youngsters learning how to read picture graphs? Use these five examples to asess your learners' comprehension. Consider rearranging them differently; the presentation is slightly congested.
Curated OER
Statistics Problems
In this statistics instructional activity, 3rd graders answer questions about different graphs including bar graphs, picture graphs, line graphs, and more. Students complete 20 multiple choice questions.
Curated OER
Practice Dividing by 8
In this dividing by 8 worksheet, students use the data in the math table to help them complete the pictograph chart on the right. Students use the pictograph to help them answer the six word problems.
Curated OER
Graphs #3
In this graphing worksheet, learners use tally marks to create a pictograph of lemonade sold each day. A website reference for additional resources is given.
Curated OER
Graphing Activity #3
For this graph worksheet, students use information in a tally chart to complete a pictograph of favorite pizza toppings and answer 4 related questions. A website reference for additional resources is given.
Curated OER
The Egg Hunt- Using a Graph to Answer Data Questions
In this pictograph activity, students answer questions based on a pictograph that shows colored Easter eggs. They follow the key that shows that each egg picture is equal to 10 eggs. They fill in the blanks with answers to how many, who...
Curated OER
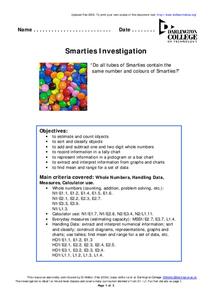
Smarties Investigation
In this math worksheet, learners participate in an investigation of Smarties candy. For example, students estimate how many candies they have in each color, count the actual number, and record the information in a tally chart.
Curated OER
Gummy Bear Color Graph
In this graphing worksheet, students see color 5 color words at the bottom of a graph that contains black line pictures of gummy bears. There are no directions or questions given with the graph.
Curated OER
Data Collection and Presentation
Middle and high schoolers collect and analyze data from four different activities. The activities include information about classmates, tallying colors of cars in a parking lot, stem and leaf plots, and making a histogram from...
Curated OER
Graphs and money
In this graphs and money worksheet, students complete word problems about different kinds of graphs and money in those graphs. Students complete 10 multiple choice problems.
Curated OER
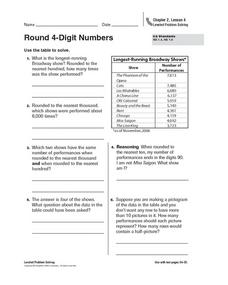
Round 4-Digit Numbers
In this rounding numbers practice worksheet, students sharpen their problem solving skills as they solve 6 story problems that require them to round 4-digit numbers.
Curated OER
Make Ten to Add
In this making ten worksheet, students learn to use pictographs or math tables to help them learn to make ten in addition word problems.
Curated OER
Picture Graphs
In this mathematics worksheet, students look at pictures and identify how many of each object is illustrated. Then they graph their results on the graph given. Students also draw tally marks to count how many faces are in the pictures.
Curated OER
Energy Resources
In this energy resources worksheet, students complete 12 questions in the format of puzzles, teasers, and twisters. Examples include a modified cryptoquip and pictogram.
Curated OER
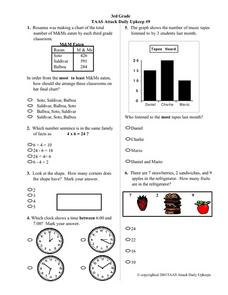
3rd Grade TAAS Attack Daily Upkeep #9
In this math literacy worksheet, 4th graders practice interpreting the pictographs in order to assemble the information to find the solutions to the 13 problems.
Curated OER
Graphs in the News
In this graphs worksheet, learners locate 2 kinds of graphs in the newspaper and answer short answer questions about them. Students complete 3 questions.
Curated OER
Frequency, Histograms, Bar Graphs
In this statistics worksheet, learners plot and graph their data, then interpret the data using the correct form of graphs. There are 3 detailed questions with an answer key.
Curated OER
Let's Graph It! Pre-Test
For this graphing worksheet, students complete a set of 10 multiple choice questions, clicking on a link to see correct answers or print the page.
Curated OER
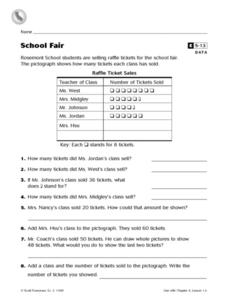
School Fair
In this data worksheet, learners look over a table containing data collected from selling raffle tickets and then answer 8 short answer questions relating to the table.
Curated OER
Collecting Data
For this data collection worksheet, students read about how data is collected and organized. They also learn about a hypothesis. Students read through examples of different charts and then answer 23 questions pertaining to data...
Curated OER
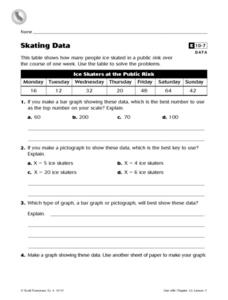
Skating Data
In this collecting data worksheet, 4th graders view a table on ice skaters at a public rink in order to answer 2 multiple choice questions, 1 short answer question and make a graph showing one piece of the data.
Curated OER
Let's Graph It
In this let's graph it worksheet, student interactively answer 10 multiple choice questions about graphing data and types of graphs, then click to check their answers.
Curated OER
Showing Favorites
In this tally chart worksheet, students use the tally chart on the page to answer 2 questions. They then solve the last 2 questions using their own tally chart.
Curated OER
Graphing Words Word Search
In this data vocabulary activity, students search for 16 graph-related words in a word search grid. Each word relates to graphing and collecting data.


