Hi, what do you want to do?
Discovery Education
Discovery Education: Web Math: Plot of a Mathematical Expression
This WebMath site provides an interactive 'solvers' to plot x and y coordinates on a graph.
McGraw Hill
Glencoe: Self Check Quizzes 2 Stem and Leaf Plots
Use Glencoe's Math Course 2 randomly generated self-checking quiz to test your knowledge of Stem-and-Leaf Plots. Each question has a "Hint" link to help. Choose the correct answer for each problem. At the bottom of the page click the...
Math Is Fun
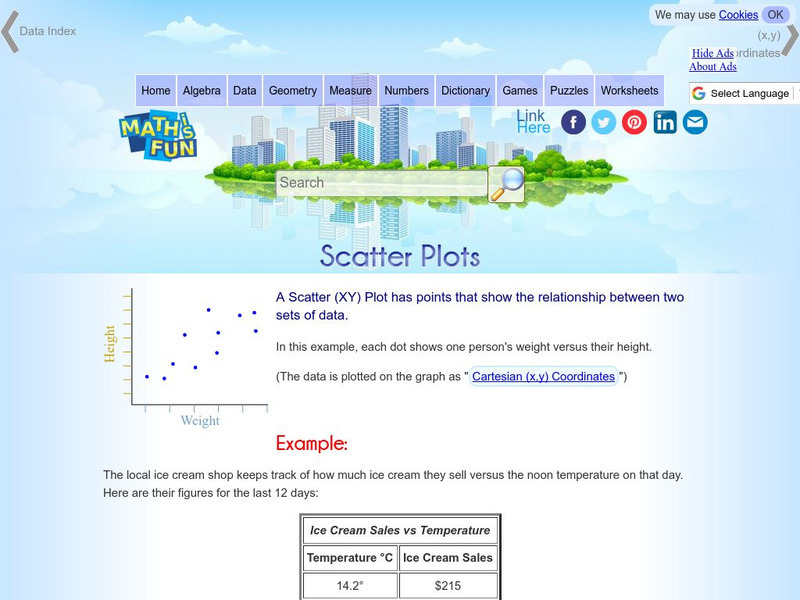
Math Is Fun: Scatter Plots
Explains, with examples, what scatter plots are and how to interpret the data. Discusses trends, interpolation and extrapolation, and correlation. Includes a set of practice questions.
McGraw Hill
Glencoe: Self Check Quizzes 1 Stem and Leaf Plots
Use Glencoe's randomly generated self-checking quiz to test your knowledge of Stem-and-Leaf Plots. Each question has a "Hint" link to help. Choose the correct answer for each problem. At the bottom of the page click the "Check It" button...
Discovery Education
Discovery Education: Web Math: Plots and Geometry
This site provides descriptions and helpful hints regarding conic sections - circles, parabolas, ellipses, and hyperbolas. Content also includes interactive problem solvers complete with a full analysis of the math behind the answer.
Analyze Math
Analyze Math: Plot Points in Polar Coordinates
The interactive tutorial examines how to plot points given by their polar coordinates. Learners use the applet to plot polar coordinates.
McGraw Hill
Glencoe: Self Check Quizzes 2 Line Plots
Use Glencoe's Math Course 2 randomly generated self-checking quiz to test your knowledge of line plots. Each question has a "Hint" link to help. Choose the correct answer for each problem. At the bottom of the page click the "Check It"...
McGraw Hill
Glencoe: Self Check Quizzes 2 Box and Whisker Plots
Use Glencoe's Math Course 2 randomly generated self-checking quiz to test your knowledge of Box-and-Whisker Plots. Each question has a "Hint" link to help. Choose the correct answer for each problem. At the bottom of the page click the...
Khan Academy
Khan Academy: Coordinate Plane: Plot Ordered Pairs
Khan Academy: Coordinate plane: plot ordered pairs practices plotting an ordered pair on the x (horizontal) axis and y (vertical) axis of the coordinate plane.
Mathematics Archives
Math Archives: Visual Calculus: Polar Coordinates
This site offers a tutorial for Polar Coordinates. After actively involving in the site, students should be able to convert from rectangular coordinates to polar and from polar to rectangular. Students will also be able to plot points...
University of Vienna (Austria)
Maths Online: Recognize Functions 3
An excellent place to test your ability to recognize the graphs of sine and cosine and their various associated forms. A Java applet is also included to plot your own function.
Khan Academy
Khan Academy: Read Line Plots (Data With Fractions)
Practice reading and interpreting data that is graphed on line plots. The data graphed includes fractions. Students receive immediate feedback and have the opportunity to try questions repeatedly, watch a video or receive hints....
Khan Academy
Khan Academy: Line Plots Review
Reviews what line plots are and how to make them. Includes some practice problems with explanations of the solutions.
Khan Academy
Khan Academy: Creating Box Plots
More practice making box plots to summarize data sets. Students receive immediate feedback and have the opportunity to try questions repeatedly, watch a video or receive hints.
Quia
Ixl Learning: Scatter Plots
Brush up on your math skills relating to scatter plots then try some practice problems to test your understanding.
Khan Academy
Khan Academy: Reading Box Plots
Practice reading information presented in box plots. Students receive immediate feedback and have the opportunity to try questions repeatedly, watch a video or receive hints.
Khan Academy
Khan Academy: Creating Dot Plots
Practice creating dot plots. Dot plots are very similar to frequency tables, but they make it easier to see the data. Students receive immediate feedback and have the opportunity to try questions repeatedly, watch a video or receive hints.
Khan Academy
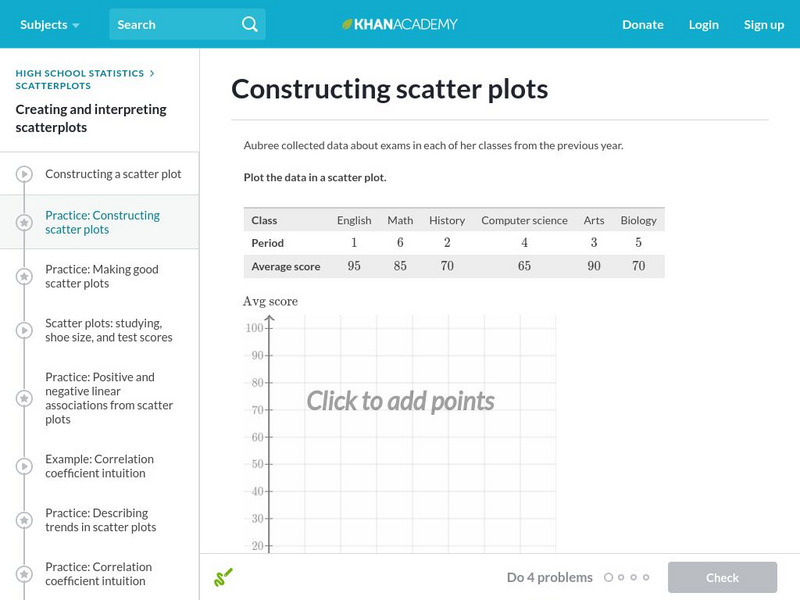
Khan Academy: Constructing Scatter Plots
Practice plotting points to construct a scatter plot. Students receive immediate feedback and have the opportunity to try questions repeatedly, watch a video, or receive hints.
Other
Nearpod: Construct & Interpret Scatter Plots
In this instructional activity on scatter plots, 8th graders will learn how to interpret scatter plots and then graph them using a data table.
Other
Nearpod: Displaying Data: Box Plots
In this lesson plan, students will learn how to create and intrepret box plots using the 5-number summary.
University of Waterloo (Canada)
Univ. Of Waterloo: Wired Math: Linear Graphing: Graphing and Analyzing [Pdf]
The mathematics resource assesses students on linear relations. The activity has problems with graphing and analyzing linear relations. Some of the topics included are variation, scatter plots and linear relationships. The worksheet has...
Wolfram Research
Wolfram Math World: Complex Plane
This math site gives a visual representation of a complex plane with several values plotted, the site explains that any complex number can be plotted on such a plane. The site contains links to related words and topics.
Texas Instruments
Texas Instruments: Math Today for Ti: Is Leisure Time Really Shrinking
Students will to organize data from the USA TODAY Snapshot, "Is leisure time really shrinking?," into two scatter plots and determine the quadratic model for each scatter plot. Students will determine if these graphs intersect and learn...


