Hi, what do you want to do?
Annenberg Foundation
Annenberg Learner: Learning Math: Min, Max and the Five Number Summary
Explore how to interpret a large set of data by dividing it up into smaller portions in order to answer statistical questions.
Annenberg Foundation
Annenberg Learner: Organizing Data in a Stem and Leaf Plot
A stem and leaf plot is a graphical representation for investigating variation. You will convert an ordered stem and leaf display grouped by tens into an ordered display grouped by fives.
Better Lesson
Better Lesson: Places Everyone. Analyzing and Creating Stem and Leaf Plots
The students will be using discovery techniques to learn about stem and leaf plots.
Scholastic
Scholastic: Cultivating Data
Students will understand key concepts of data analysis and their graphic representations. Students will construct and interpret data tables, line plots, box-and-whisker plots and stem-and-leaf plots, scatterplots with line of best fit,...
National Council of Teachers of Mathematics
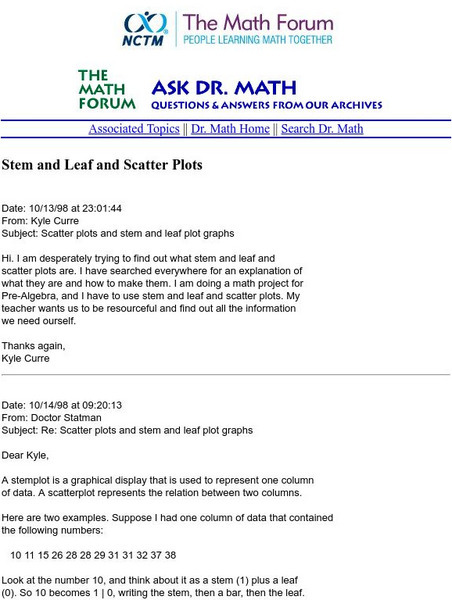
The Math Forum: Nctm: Ask Dr. Math: Stem and Leaf and Scatter Plots
This site is a question/response page which focuses on stem-and-leaf representation and how to construct scatter plots. Dr. Math works through an example and gives commentary notes. Site also contains links for more help.
CK-12 Foundation
Ck 12: Plot Polar Coordinates
[Free Registration/Login may be required to access all resource tools.] Here you will learn how to convert and graph complex numbers in trigonometric or polar form using the polar coordinate system, which is similar in some ways to (x,...
Better Lesson
Better Lesson: Box and Whiskers Activity
The students will be working in stations to construct and analyze box plots. All activities are of high interest and rich in content.
Quia
Ixl Learning: Frequency Tables
Brush up on your math skills relating to frequency tables then try some practice problems to test your understanding.
York University
York Univ.: Statistical Graphics for Multivariate Data
Provides several graphical representations of multivariate data. This paper explains the graphs such as the scatter plot and several other graphs as well. Site is presented in notes and outline format.
Oswego City School District
Regents Exam Prep Center: Regression Analysis
A collection of lesson ideas, a practice activity, and teacher resources for exploring regression analysis.
Duke University
Duke University: Web Feats Ii: Lessons on Regression at Hessian
This site has several lessons on regression, "Designed to help students visualize topics associated with lines of regression, given a set of data points." Go to the teacher notes to find the objectives and standards which apply.
Khan Academy
Khan Academy: Histograms Review
A histogram displays numerical data by grouping data into "bins" of equal width. Each bin is plotted as a bar whose height corresponds to how many data points are in that bin.
Alabama Learning Exchange
Alex: Land Surveying Project
This project resulted from of the collaboration of a computer aided drafting teacher, Chris Bond, and a math teacher, Lee Cable, (Hewitt-Trussville High School) to provide higher math expectations in CT and real life application in...


