Curated OER
A Slice of Pi
Math pupils, by viewing a video, discover the history of pi and some of the applications of its uses in the world today. They conduct an experiment by measuring the diameter and circumference of various circular objects to calculate...
Curated OER
Length, Perimeter, and Area
Pupils explore the concepts of length, perimeter, and area. In this math lesson, students use Shape Explorer to practice finding length, perimeter, and area.
Curated OER
Scattered About
Students are introduced to the concept of scatter plots after reviewing the various types of graphs. In groups, they analyze the type of information one can receive from a scatter plot and identify the relationship between the x and y...
Curated OER
Introducing the Concept: Percents
Students explore the math concept of percents. In this percents lesson, students examine visual examples of the relationships among fractions, decimals, and percents. Students also practice solving problems that their instructors model.
Curated OER
Baseball Math
Students collect data on baseball plays. In this statistics lesson plan, students graph their data and make predictions based on their observation. They calculate what the probability is that a favorable outcome would happen.
Curated OER
The Integration of Science and Math Through Ecosystems
Students use the disciplines of math and science to examine ecosystems. In groups, they calculate the amount of supplies they would need to live in the classroom for one day, a week and a year. Using this information, they apply it to...
Curated OER
All in the Family
Students use data to make a tally chart and a line plot. They find the maximum, minimum, range, median, and mode of the data. Following the video portion of the lesson, students will visit a Web site to test their data collection skills...
Curated OER
Graphs and Functions
Use this series of activities to introduce learners to graphing functions. They graph both linear and quadratic equations by hand and with a Graph Sketcher Tool. Several imbedded links and handouts are included in the activity.
Curated OER
Tessellations: Geometry and Symmetry
Learners explore the concept of tessellations. In this tessellations lesson, students use an applet to construct tessellations. Learners use regular polygons to construct tessellations. Students find patterns and symmetry in their...
Curated OER
No Foot, No Horse
Why do horses wear shoes? Why do people wear shoes? Using worksheets, which are embedded in the plan, learners write descriptive paragraphs about their own shoes, classify a pile of shoes, and also engage in math games about the variety...
Curated OER
Introducing the Concept: Rates
Sixth graders explore rates as a specific type of ratio, using visual examples of unit rates and unit prices to increase comprehension. They also practice solving problems that are modeled by the instructor. The well-scripted...
Curated OER
Blubber Gloves
The ways that animals adapt to their environments is quite remarkable. In this life science lesson, fifth graders take a look at some of the ways that aquatic animals that live in Arctic or Antarctic waters survive. They perform an...
Curated OER
Past and Present: Using baseball statistics to teach math
Students use baseball cards to add up batting average and reinforce math skills. In this batting averages lesson plan, students use old baseball cards to practice different math skills and look at other baseball statistics.
Curated OER
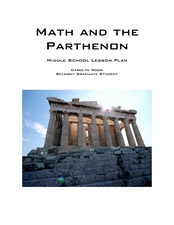
Math and the Parthenon
Pupils relate math to different areas of construction. In this algebra lesson, students identify the relationship between shapes and the way math is used in architecture. They investigate properties of the Parthenon as it relates to...
Curated OER
Slopey Math
Students identify the slope of a line and use it to solve real life problems. In this algebra lesson, students write linear equations in slope intercept form and make a correlation to its relation to the real world. They use the slope an...
Curated OER
Applied Science - Science and Math Post-Lab
Students use scientific tools. In this Applied Science lesson, students investigate the use of scientific tools to enhance observation and discovery. Students indicate how each tool assists scientific work.
Texas Instruments
Say What You Mean!
Young scholars analyze data and identify the mean. In this probability lesson, students log data in the TI and construct scatter plots from the data. They identify properties of a scatterplot.
Alabama Learning Exchange
Pennies, Pennies and More Pennies
Learners determine the number of pennies needed to fill a room. In this pennies lesson plan, students work in groups to determine the number of pennies needed to fill a room. They compute the probability of the head of a pin...
Curated OER
An Introduction to Mathematica and the "Birthday Problem"
Twelfth graders determine the probability of two people in their class sharing the same birthday. In this determining the probability of two people in their class sharing the same birthday problem lesson, 12th graders use...
Curated OER
Chances Are-Part 1
Young scholars are introduced to the idea of probability by discussing the likelihood of events occurring. Pupils describe events that are certain, impossible, likely, and unlikely to occur. They determine the likelihood of an event...
Curated OER
The Perfect Principal
Students demonstrate their understanding of math skills. In this data analysis lesson, students complete a worksheet requiring them to calculate mean, median, and mode, and create and interpret graphs. Lesson is intended as an assessment...
Curated OER
Math Lesson: What Do You Want to Know? - Country Statistics
Students are able to identify the characteristics of a variety of graphs (i.e. bar graph, line graph, pie graph, scatter plot, population pyramids, etc.) They recognize how the type of data to be presented plays a role in choosing the...
Curated OER
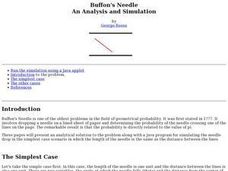
Buffon's Needle An Analysis and Simulation
If you dropped a needle on a lined sheet of paper what is the probability that the needle will cross one of the lines on the page? Surprise your class with how calculating this probability can approximate pi. This question is known...
Curated OER
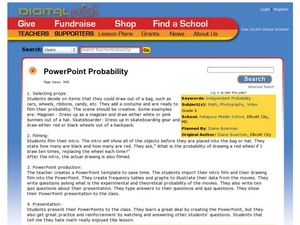
PowerPoint Probability
Sixth graders investigate film making by creating a video about probability. In this math visualization lesson, 6th graders create a presentation for their class demonstrating the probability of random events taking place in the...
Other popular searches
- Probablity Math Lessons
- Probability Math Lessons
- Math Lessons Probabilities
- Math Lessons/ Probability
- Math Lessons on Probability


