Curated OER
Probability
Sixth graders explore probability. They analyze a class chart and list the letters of the alphabet according to frequency. Using the data collected, they complete probability problems.
Curated OER
M&M Graphing and Probability
Learners create a variety of graphs. They count, sort, and classify M&M's by color and record data on a chart. They use data from the chart to create pictographs, bar graphs and circle graphs. They analyze data and determine...
Curated OER
Is the Probability Probable?
Third graders compare experimental results with mathematical expectations of probabilities. They utilize a worksheet imbedded in this plan to gain practice with the concept of probability.
Curated OER
Math Made Easy
Students evaluate word problems. In this problem solving lesson plan, students are presented with word problems requiring graphing skills and students work independently to solve.
Curated OER
Leaf Patterns
First graders explore the existence of patterns in everyday items. In this science and math integrated lesson, 1st graders match leaves with a name word card and organize them into four patterns. This lesson includes a reading of And the...
EngageNY
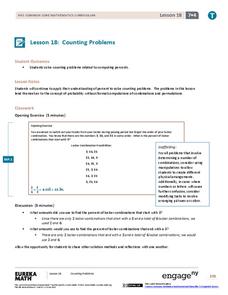
Counting Problems
Solving these percent problems is a matter of counting. Pupils find percents by counting the number of events that meet the criteria and the total number of possibilities. Participants create the ratio and convert it to a percent to...
Inside Mathematics
Archery
Put the better archer in a box. The performance task has pupils compare the performance of two archers using box-and-whisker plots. The resource includes sample responses that are useful in comparing individuals' work to others.
Shodor Education Foundation
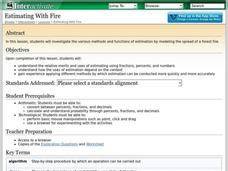
Estimating With Fire
Watch the damage from a forest fire in this interactive simulation activity that challenges learners to estimate the burn area using different approaches. Learners are given a worksheet to track the different burn patterns and practice...
EngageNY
Creating a Histogram
Display data over a larger interval. The fourth segment in a 22-part unit introduces histograms and plotting data within intervals to the class. Pupils create frequency tables with predefined intervals to build histograms. They describe...
EngageNY
Looking More Carefully at Parallel Lines
Can you prove it? Making assumptions in geometry is commonplace. This resource requires mathematicians to prove the parallel line postulate through constructions. Learners construct parallel lines with a 180-degree rotation and then...
EngageNY
Applications of Congruence in Terms of Rigid Motions
Corresponding parts, congruent parts, congruent corresponding parts—what does it all mean? The resource challenges pupils to identify corresponding parts for pairs of figures. It uses examples of figures that undergo rigid...
EngageNY
Using a Curve to Model a Data Distribution
Show scholars the importance of recognizing a normal curve within a set of data. Learners analyze normal curves and calculate mean and standard deviation.
Curated OER
The Average Kid
Students determine the traits they have in common with other students in the class and create visual profiles of the "average" boy and the "average" girl.
Curated OER
Investigation-Design Your Own Spinner
Young scholars design their own spinner that meets the given criteria. In this math lesson, students discuss biased versus unbiased events or outcomes when dealing with probability. Young scholars are given 5 criteria that must be...
Curated OER
Scatterplots
Young scholars evaluate equations and identify graphs. In this statistics lesson, students identify plotted points on a coordinate plane as having a positive, negative or no correlation. They complete basic surveys, plot their results...
Curated OER
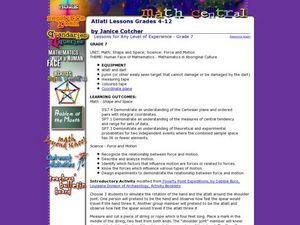
Atlatl Lessons for Grade 7
Seventh graders examine force and motion. In this seventh grade mathematics/science lesson plan, 7th graders collect and analyze data regarding the use of an atlatl to throw a spear. Students describe and analyze the motion which leads...
Balanced Assessment
Initials
Learners explore the meaning of groups formed through permutations and combinations with an activity that asks individuals to determine the total number of pupils needed to guarantee that at least one pair has the same initials....
Curated OER
Grade 3: Pretzel Probability
Third graders discuss prizes included in products to stimulate sales. They discuss a pretend pretzel company and it's sticker promotion. Students compute how many boxes of pretzels they will need to collect in order to be sure of having...
Curated OER
Heads-Up Probability
Second graders use tree diagrams to predict the possible outcomes of coin tosses. The data they collect and graph also help them predict the likelihood of getting heads or tails when tossing coins the next time.
Curated OER
Guess the Card -Probability
This site is used for distance education purposes and professional development of teachers
Curated OER
Treats in a Basket
Students explore probability by participating in an experimental activity. In this number statistics lesson plan, students collaborate in groups in which they move a game piece around a board. Students calculate their probability of...
Curated OER
Probability
Fourth graders predict future outcomes with an investigation of the mathematical principle of probability using spinners constructed by them. The spinner is a hands on application an they combine it with writing a ratio for the...
Curated OER
Probability
For this problem solving worksheet, students determine which spinner will most frequently land on a color choice of a color wheel. In this coloring and multiple choice worksheet, students will answer two questions.
Curated OER
Data Analysis, Probability, and Discrete Mathematics
Fourth graders analyze the data in a bar graph, pictograph, line graph, and a chart/table and draw conclusions based on the data. They discuss each type of graph, write questions for each graph, and analyze the data as a class.
Other popular searches
- Probablity Math Lessons
- Probability Math Lessons
- Math Lessons Probabilities
- Math Lessons/ Probability
- Math Lessons on Probability


