Curated OER
Twelve Days of Christmas--Prediction, Estimation, Addition, Table and Chart
Scholars explore graphing. They will listen to and sing "The Twelve Days of Christmas" and estimate how many gifts were mentioned in the song. Then complete a data chart representing each gift given in the song. They also construct...
Primary National Strategy
Ordering and Counting
Are you in need of a 5-day unit intended to teach little learners how to count to 20? This is a well-structured complete set of lessons which employ a variety of methods to instruct learners about various ways to count from 1 to 20. They...
Curated OER
Measures
Estimate and explore the length and weight of classroom items using standard measurement and scales. Students will work in groups to determine appropriate measuring tools, weigh or measure items, and record their results on a data chart....
Curated OER
My Test Book: Reading Graphs
In this online interactive math skills learning exercise, students solve 10 multiple choice math problems that require them to read and interpret graphs. Students may view the correct answers.
Curated OER
Valentine's Day Ordering and Comparing
After a lesson on tables and charts, students can practice their data-reading skills by comparing how many Valentine's cards Heather received and gave out over the last few years. Additionally, students can practice their "greater than"...
Curated OER
Camp Out
In this reading tables worksheet, students read a table regarding camping activities. Students respond to 6 questions regarding the data.
Curated OER
My Test Book: Reading Graphs
In this online interactive math skills worksheet, students solve 10 multiple choice math problems that require them to read and interpret graphs. Students may view the correct answers.
Curated OER
Lesson 3 How Do You Read Stock Quotes Online ?
Students understand how to get and interpret stock price data online. They describe certain aspects of various corporations and know the meanings of important terms involving the stock market.
Curated OER
Who Represents You?
Students investigate Congress and how individuals are represented in this Country. In this government instructional activity, students complete worksheets research government web sites to determine which senators and congressmen...
Education World
The African American Population in US History
How has the African American population changed over the years? Learners use charts, statistical data, and maps to see how populations in African American communities have changed since the 1860s. Activity modifications are included to...
Alabama Learning Exchange
Yummy Apples!
Young learners listen to a read aloud of Gail Gibbons book, Apples and the story A Red House With No Windows and No Doors. They compare characteristics of a number of kinds of apples, graph them and create a apple print picture. Learners...
Curated OER
Study Buddies: Adding Three-Digit Numbers
In this math worksheet, students will work with a coach to solve a story problem in which they must add three-digit numbers. Students will follow a step-by-step process and notes are provided for the coach.
Curated OER
Place Value Made Simple
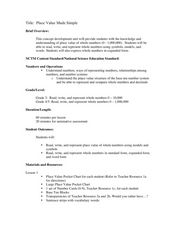
Elementary schoolers explore place value to the millions place. They construct and evaluate the value of numbers. Working in small groups, pupils problem solve with pocket place value charts, and examine standard and expanded forms. This...
Curated OER
Exploring Renewable Energy Through Graphs and Statistics
Ninth graders identify different sources of renewable and nonrenewable energy. In this math lesson, learners calculate their own carbon footprint based on the carbon dioxide they create daily. They use statistics to analyze data on power...
Mathed Up!
Negative Numbers
Individuals read tables with temperatures and times in order to distinguish the town with the lowest temperature or most extreme temperature difference. Each of the eight questions has three sub-questions that use the same charts.
Curated OER
Study Buddies: Adding Two-Digit Numbers
Some times a simple lesson plan is all you need. Here are 2 worksheets that can be used as a lesson plan on problem solving, addition, and partner work. The first worksheet has learners use a tens and ones charts to practice adding...
Beyond Benign
Plastic Bags
Paper or plastic? Explore the environmental effects of using plastic bags through mathematics. Learners manipulate worldwide data on plastic bag consumption to draw conclusions.
Curated OER
Data Analysis: For Little Learners
Using pictographs, tally charts, and surveys, kids learn all about data analysis and collection. They make surveys, collect data, then construct pictographs and tally charts to organize their information.
Curated OER
An Introduction to Data Reading and Computations
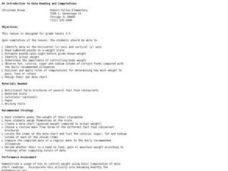
Students discover data reading and computations. In this math lesson plan, students collect nutritional data about intakes of certain foods compared with daily recommended allowances. Students create their own data charts based on their...
Curated OER
A Nation of Nations Lesson Plan: Charting African Ethnicities in America
Students read a portion of the narrative, The Transatlantic Slave Trade, to explain the ethnic origins of enslaved Africans brought to the US. They create charts and bar graphs comparing ethnicities in the lowlands and tidewater regions.
Curated OER
Tally Charts
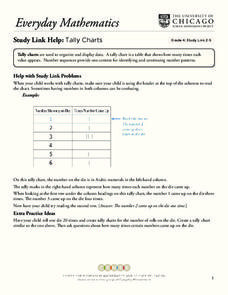
In this tally charts worksheet, learners discuss how to use a tally chart and how to read the chart. Once students record information on a tally chart they answer questions showing their ability to read a tally chart.
Curated OER
Tables, Charts and Graphs
Learners examine a science journal to develop an understanding of graphs in science. In this data analysis lesson, students read an article from the Natural Inquirer and discuss the meaning of the included graph. Learners create a...
Curated OER
Statistics: Reading and interpreting production graphs
Students interpret and create different types of graphs. They analyze data from charts, develop a survey and design appropriate graphic illustrations and make a presentation.
Curated OER
Word Problems: Distance = Rate x Time
In this word problem worksheet, learners read word problems, and set the information into the distance formula. They solve the formula to determine the distance, rate and time. This two-page worksheet contains six problems, with answers.


