Khan Academy
Khan Academy: Interpreting Graphs of Proportional Relationships
Practice reading and analyzing graphs of proportional relationships. Students receive immediate feedback and have the opportunity to try questions repeatedly, watch a video or receive hints.
Math Graphs
Houghton Mifflin: Math Graphs: Interpreting a Graph 3 [Pdf]
Students identify or sketch quantities using a given graph. The resource consists of an enlarged printable version of a math graph available in PDF format.
Math Graphs
Houghton Mifflin: Math Graphs: Interpreting a Graph 2 [Pdf]
Students identify or sketch quantities using a given graph. The resource consists of an enlarged printable version of a math graph available in PDF format.
Government of Alberta
Learn Alberta: Math Interactives: Exploring Data Display and Graphs
This multimedia Learn Alberta math resource focuses on graphing data. In the video portion, students will see how math is involved in the display of merchandise in stores. The accompanying interactive component provides an exploration...
Khan Academy
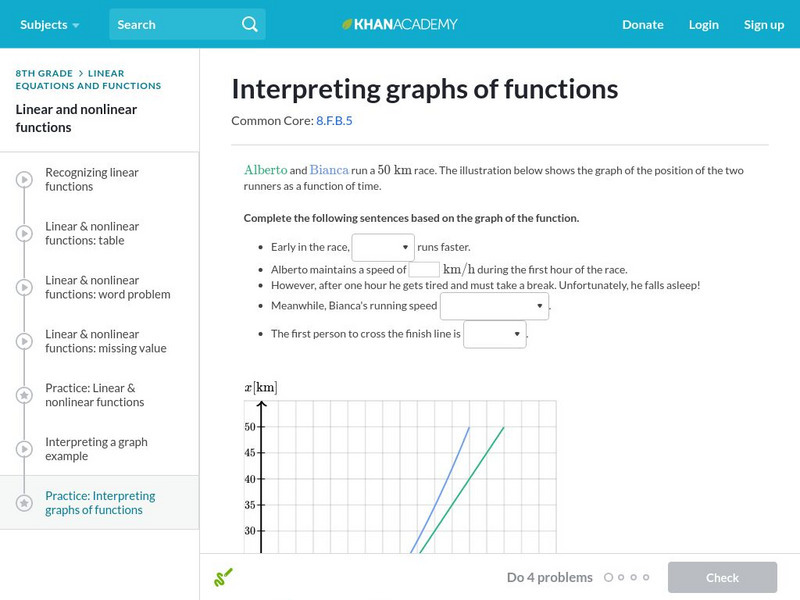
Khan Academy: Interpreting Graphs of Functions
Interpret the graphs of both linear and nonlinear functions. Students receive immediate feedback and have the opportunity to try questions repeatedly, watch a video, or receive hints.
Math Graphs
Houghton Mifflin: Math Graphs: Interpreting a Graph 1 [Pdf]
Students identify or sketch quantities using a given graph. The resource consists of an enlarged printable version of a math graph available in PDF format.
Math Graphs
Houghton Mifflin: Math Graphs: Interpreting a Graph [Pdf]
Students use a given graph to identify and sketch different quantities. The math graph is available in PDF format.
Beacon Learning Center
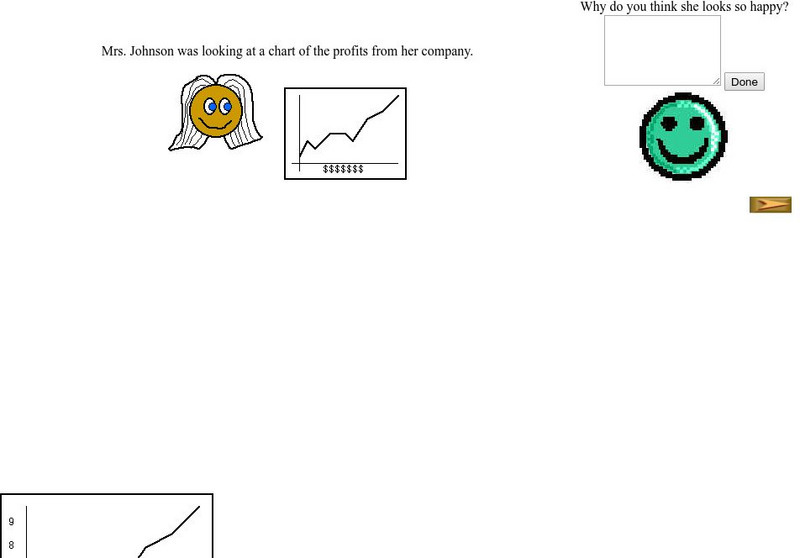
Beacon Learning Center: Interpreting Line Graphs
This site is a lesson on creating and interpreting a line graph. It explains how a line graph is created and then asks questions about what is learned from the data. Students type in open responses, and answers and feedback follow.
Other
Nearpod: Interpreting Slope & Y Intercept
For this lesson on interpreting slope and y-intercept, 8th graders will learn how to identify the slope and the y-intercept of a line in order to identify if a proportion is demonstrated.
Math Graphs
Houghton Mifflin: Math Graphs: Slope of a Tangent Line 1 [Pdf]
Students use the given graph to estimate the slope of a tangent line. The resource consists of an enlarged printable version of a math graph available in PDF format.
Math Graphs
Houghton Mifflin: Math Graphs: Slope of a Tangent Line 2 [Pdf]
Learners use the given graph to estimate the slope of a tangent line. The resource consists of an enlarged printable version of a math graph available in PDF format.
Math Graphs
Houghton Mifflin: Math Graphs: Slope of a Tangent Line 3 [Pdf]
Students use the given graph to estimate the slope of a tangent line. The resource consists of an enlarged printable version of a math graph available in PDF format.
Math Graphs
Houghton Mifflin: Math Graphs: Slope of a Tangent Line 4 [Pdf]
Students use the given graph to estimate the slope of a tangent line. The resource consists of an enlarged printable version of a math graph available in PDF format.
Math Graphs
Houghton Mifflin: Math Graphs: Slope of a Tangent Line 9 [Pdf]
Learners examine the concept of a slope related to differential calculus. The math graph is available in PDF format.
Math Graphs
Houghton Mifflin: Math Graphs: Slope of a Tangent Line 10 [Pdf]
Learners examine the concept of a slope related to differential calculus. The math graph is available in PDF format.
Math Graphs
Houghton Mifflin: Math Graphs: Average Rate of Change 1 [Pdf]
Students use the graph of "f" to determine the average rate of change and sketch a tangent line. The problem is available in PDF format.
E-learning for Kids
E Learning for Kids: Math: Movie Theater: Circle Graphs
On this interactive website, students practice interpreting information in circle graphs.
Government of Alberta
Learn Alberta: Math Interactives: Exploring Election Data
Using actual Alberta provincial election results, students have the opportunity to interpret election data using a variety of graph types. Pictographs, line graphs, bar graphs, circle graphs, and data tables are covered in this...
Texas Education Agency
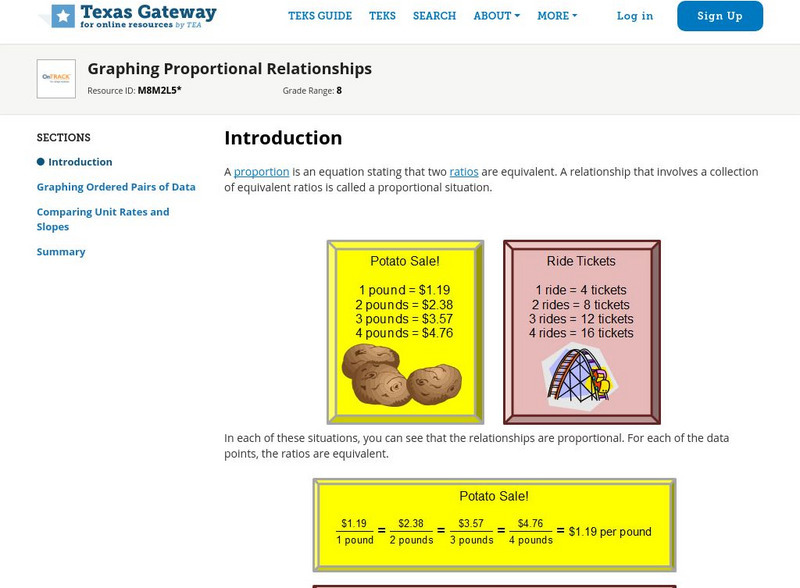
Texas Gateway: Graphing Proportional Relationships
Given a proportional relationship, students will be able to graph a set of data from the relationship and interpret the unit rate as the slope of the line.
E-learning for Kids
E Learning for Kids: Math: Elephant Plant: Data
Gyan's family grows flowers. Can you help him interpret displayed data about their plants?
Khan Academy
Khan Academy: Solve Problems With Bar Graphs 1
Read and interpret bar graphs. Students receive immediate feedback and have the opportunity to try questions repeatedly, watch a video or receive hints.
Primary Resources
Primary Resources: Tally and Bar Charts
Lots of good materials for teaching about tally marks and bar graphs.
Khan Academy
Khan Academy: Read Picture Graphs (Multi Step Problems)
Interpret picture graphs to answer questions about a context. Students receive immediate feedback and have the opportunity to try questions repeatedly, watch a video or receive hints.
Khan Academy
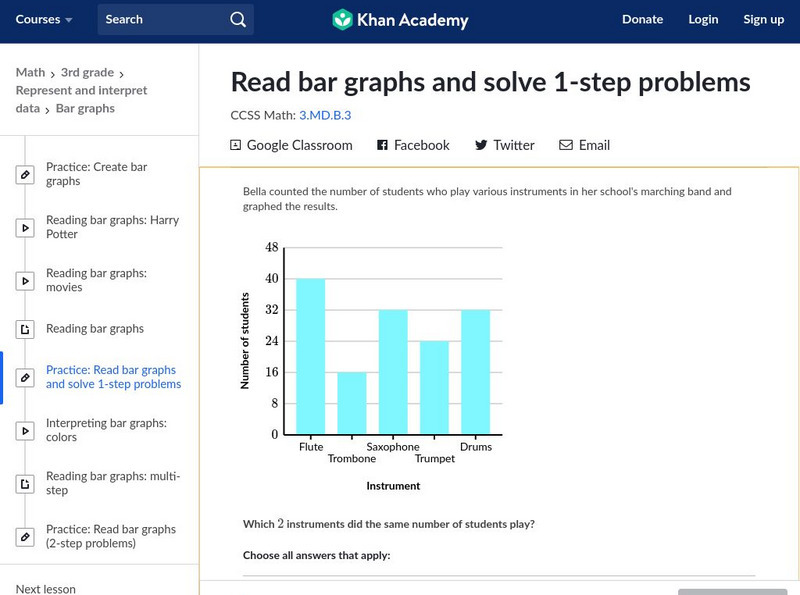
Khan Academy: Read Bar Graphs and Solve 1 Step Problems
Interpret bar graphs to answer questions about a context. Students receive immediate feedback and have the opportunity to try questions repeatedly, watch a video or receive hints.

![Houghton Mifflin: Math Graphs: Interpreting a Graph 3 [Pdf] Unknown Type Houghton Mifflin: Math Graphs: Interpreting a Graph 3 [Pdf] Unknown Type](https://d15y2dacu3jp90.cloudfront.net/images/attachment_defaults/resource/large/FPO-knovation.png)

