Curated OER
The Perfect Principal
Students demonstrate their understanding of math skills. In this data analysis lesson, students complete a worksheet requiring them to calculate mean, median, and mode, and create and interpret graphs. Lesson is intended as an assessment...
Curated OER
Count On It!
Students investigate money. In this consumer math lesson, students use coins, identify their value, then group them in various ways to equal a dollar.
Curated OER
Temperature High and Lows
Young scholars gather high and low temperature readings through email. In this temperature graphing lesson, students use a spreadsheet to input data for a graph. young scholars interpret the graphs to compare and contrast the data from...
Curated OER
Woody Sine
Students explore the concept of sine. In this sine activity, students create a sine graph from tooth picks. Students create a unit circle with tooth pick length radius. Students then take the tooth picks from the unit circle and put them...
Curated OER
Riemann Rectangle Errors
High schoolers calculate the area under a curve. In this calculus lesson, students integrate the function to find the area under the curve. They use the Ti to create a visual of the graph.
Curated OER
Square Foot Garden
Students plant a garden and keep track of it. For this geometrical garden lesson, students collect data from their garden twice a week. They graph their finding and figure out how many square feet of growing space each person needs...
Curated OER
Linear Equations in Our Every Day World!
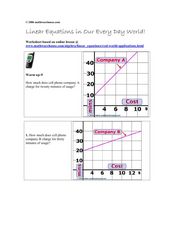
In this linear equations worksheet, students read and interpret graphed linear equations. They read a story problem, write a linear equation, and plot the points on a coordinate plane. This five-page worksheet cotnains 12...
Curated OER
Which Method Will You Choose? Finding Solutions to Systems of Equations.
Ninth graders investigate systems of linear equations. For this Algebra I lesson, 9th graders determine which method is the best for solving a systems: graphing, substitution, or elimination. Students choose...
Curated OER
Box-and-Whisker Plots
Eighth graders measure in feet and inches and convert to explore the relationship between the converted measurements. In this measurement lesson, 8th graders use the whisker and box plot to represent the measurement of a cat. ...
Curated OER
Global Statistics
Students determine statistics based on data. In this statistics lesson, students use data and record in charts. Students create graphs based on the statistics found.
Curated OER
Tall Tale Rollers
Learners explore American tall tales. In this tall tale lesson, students discover the six characteristics that are included in tall tales. Learners survey their class to find each student's favorite tall tale character and organize the...
Curated OER
Histograms
For this histograms worksheet, students solve 5 word problems based on a histogram of presidential ages at their inauguration. Next, students create a frequency table and a histogram based on a list of data which shows the average...
Curated OER
Pumped Up Gas Prices
Students calculate gas prices. In this transportation lesson, students tally the mileage and gas costs of their car for one months. They figure out how much was spent on gas and create a graph showing average gas prices over time.
Curated OER
THEMIS: A Magnetic Case of 'What Came First?'
In this magnetic reconnection worksheet, students solve seven problems using the data and graphs from the THEMIS satellite constellations, which show a series of events triggered by a magnetic reconnection. Students interpret the data in...
Curated OER
EOC Review G
In this end of course review, students factor expressions, interpret statistic problems, and identify the maximum and minimum of equations. This two-page worksheet contains 5 multi-step problems.
Curated OER
The Disappearing Honeybees: Tracking Honeybee Decline
Students practice graphing and other math skills to track number of honeybee colonies present in United States since 1978, discuss major crops that are dependent on insect pollinators, and examine reasons for decline of United States...
Curated OER
Population-Building a Foundation
Students research to find information about populations and complete world maps by labeling the current population, and determining the 10 countries with the largest population. They search the "World Population Data Sheet." On the third...
Curated OER
Cook Me Up Some Equations
Students study a variety of math concepts in the context of cooking up a meal. In this math lesson, students calculate surface area and volume. They draw and interpret different types of graphs.
Curated OER
Kindergarten Money
Students identify the various coins and their values through presentations, a rubric, a value pretest, and coin manipulatives. Money is incorporated into various activities whether at home or in school. Students create money webs using...
Curated OER
Earthquake Patterns
Students identify and interpret the cyclical nature of the Parkfield, California earthquakes. They then investigate and graph earthquake occurrences on the Mojave segment of the San Andreas fault and then on the Hayward fault in order to...
Curated OER
The Good, The Bad, The Ugly
Sixth graders examine the causes of the stock market crash of 1929. In this integrated math/history unit on the stock market, 6th graders study, research, and read stocks, visit a local bank, and create a PowerPoint to show the...
Curated OER
Linear Systems and Calories
Students define and graph properties of linear equations. In this algebra lesson plan, students write systems of equations to represent functions. They relate linear equations to the real world.
Curated OER
Living Room Redecoration
Fourth graders use math in a living room redecoration instructional activity. In this geometry instructional activity, 4th graders get the dimensions of a living room and need to find the amount and cost of paint and flooring. They read...
Curated OER
Shop 'Til You Drop
Students evaluate food prices. For this real world math lesson plan, students compare the cost of various grocery items to determine which is the best deal. They work in groups using grocery ads to decide how to get the most product for...


