Curated OER
A Bird's Eye View of our 50 States
Third graders focus on state birds as they learned absolute location (latitude/longitude) of each state, as well as their relative location (bordering states).
Curated OER
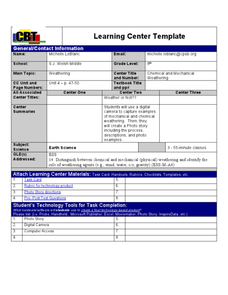
Weather... Or Not
Students observe and discuss the local weather patterns, researching cloud types and weather patterns for cities on the same latitude on the Internet. They record the data for 6-8 weeks on a graph, and make weather predictions for their...
Curated OER
The Effects of Environment on Plant Growth: Selecting Seeds for Survival on a New Planet
Fifth graders conduct experiments to compare seed germination and plant growth rates. They construct a hydroponic plant unit and a lighthouse. They care for the plants for a month and collect data for graphs. They write a report.
Curated OER
The Big O
Students investigate the characteristics of a community. They investigate the characteristics of the Omaha community through internet research and discussion. Students create books about their community.
Curated OER
Learning Festival
Fifth graders at this age are very interested in the adventures of knighthood and life in the past, so the unit will serve as a basis for teaching skills while maintaining high interest.
Curated OER
Lightning It's Shocking, It's Frightening, It's Lightning!
Third graders decide what they want to explore lightning, how to go about finding the answers, and deciding what skills they need to further study some of their questions.
Curated OER
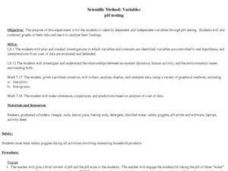
pH Testing
Students explore the use of variables in the scientific method. They identify the dependent and independent variables through pH testing. Students construct graphs of their data and analyze their findings.
Khan Academy
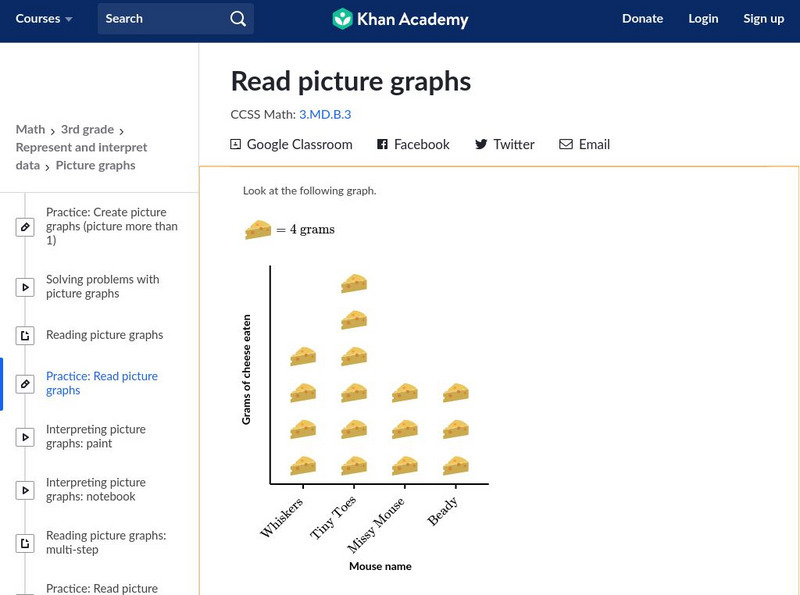
Khan Academy: Read Picture Graphs
Use picture graphs to solve word problems. Students receive immediate feedback and have the opportunity to try questions repeatedly, watch a video or receive hints. CCSS.Math.Content.3.MD.B.3 Draw a scaled picture graph and a scaled bar...
Khan Academy
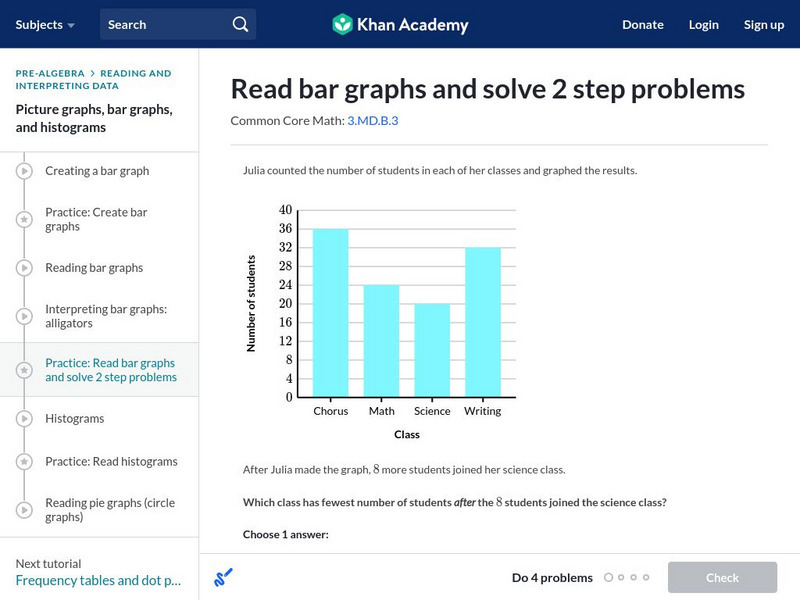
Khan Academy: Read Bar Graphs and Solve 2 Step Problems
Read and interpret a double bar graphs. Students receive immediate feedback and have the opportunity to try questions repeatedly, watch a video or receive hints. CCSS.Math.Content.3.MD.B.3 Draw a scaled picture graph and a scaled bar...
CK-12 Foundation
Ck 12: Elem Math: Visually Find the Weight in Compound Units for Multiple Items
[Free Registration/Login may be required to access all resource tools.] A video and practice questions on how to read the scales for two items and record the weights in compound metric units. [1:22]
CK-12 Foundation
Ck 12: Elem Math: Visually Finding Weight in Compound Units
[Free Registration/Login may be required to access all resource tools.] A video and practice questions on how to read a scale and record the weight in compound metric units. [1:08]
E-learning for Kids
E Learning for Kids: Math: Market Place: Measurement: Temperatures
On this interactive site students learn to link temperature to everyday life and read informal scales on a thermometer.
University of Kentucky
The Physics and Math of Music
Read about a math research project done by three college students which helps us see physics and math in music. Here's a great approach for integrating curriculum!
Rice University
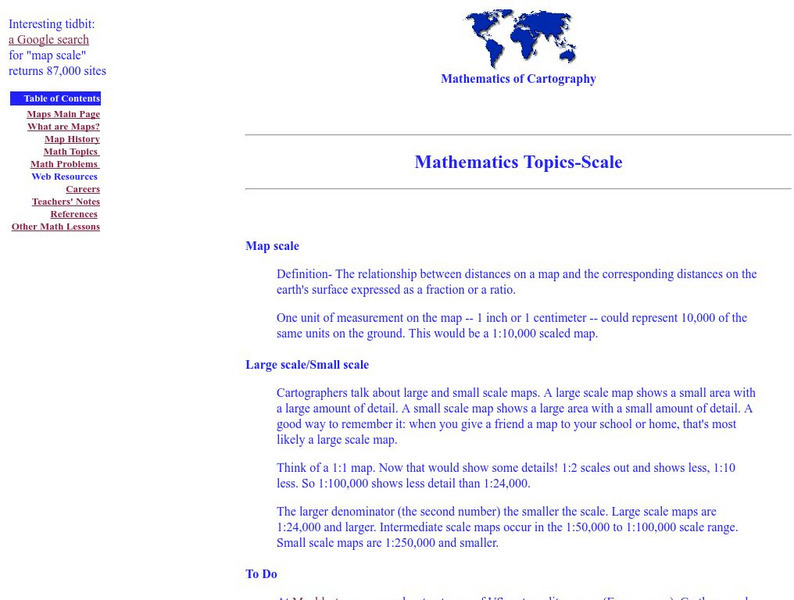
Rice University: Cynthia Lanius: Mathematics of Cartography: Scale
Definition of map scale with related cartography links and activity at Mapblast in which students create maps of their own and determine distance and scale.
TeachEngineering
Teach Engineering: Asteroid Impact
Asteroid Impact is an 8-10 class long (350-450 min) earth science curricular unit where student teams are posed with the scenario that an asteroid will impact earth. They must design the location and size of underground caverns to save...
Education Place
Houghton Mifflin: Eduplace: Make a Living Bar Graph
Student use simple data to line up in a living bar graph activity when they respond to simple questions in this lesson plan. They physically and visually represent the data. CCSS.Math.Content.3.MD.B.3 Draw a scaled picture graph and a...
Other
Cyber Sleuth Kids: Number Line Worksheets
Using a number line has just gotten a little easier for teachers and students in this site from CyberSleuth that contains an assortment of printable number line worksheets. Here you will find blank number lines, number lines with...
Khan Academy
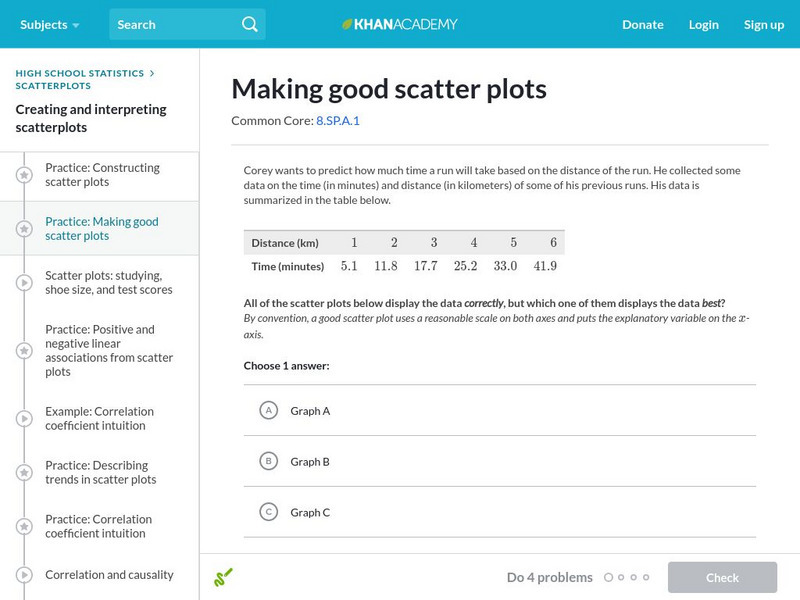
Khan Academy: Making Good Scatter Plots
A good scatter plot has the independent variable on the x-axis and the dependent variable on the y-axis. Also, the scale of both axes should be reasonable, making the data as easy to read as possible. In these practice problems, we...

