Curated OER
Lesson Plan: The Math of Removal
Students consider the plight of those who walked the Trial of Tears. In this Indian Removal lesson, students compare statistics regarding Indian survival rates.
Curated OER
Roundball for Remembrance
Students view a segment of Futures With Jaime Escalante showing the application of math in basketball, and they try to find some of these applications in a tape of a game played by their home school. This fun instructional activity...
Raytheon
Data Analysis and Interpretation
For this data analysis and interpretation worksheet, learners use charts, graphs, statistics to solve 42 pages of problems with answer key included.
Curated OER
Frequency Histograms, Bar Graphs and Tables
In this statistics learning exercise, students graph their data using frequency histograms, bar graphs and tables. They decide which graph shows the data best. There are 6 graphing problems.
Curated OER
Fun Faces of Wisconsin Agriculture: Curley's Beef Fast Facts
Students explore animal slaughter by researching the Wisconsin beef industry. In this meat statistics lesson, students practice using different math functions to identify how many burgers or sports equipment can be made from one...
Curated OER
6-8 Baseball Fun: Percentages, Decimals, and Fractions
Young scholars practice the concepts behind fractions, decimals, and percents by using sports statistics on baseball cards. In this baseball math instructional activity, students use fractions and estimation to calculate statistics....
Bowland
Olympic Cycling
Teach teenagers to think critically about data. Young data analysts must create two questions that can be answered using a provided data set on Olympic cycling times. Of course, they then have to answer their questions using mathematics.
Curated OER
Using Mean, Median, Mode, and Range through Basketball
Eighth graders use the sports pages of the newspaper to analyze the mean, median, mode and range of basketball statistics.
Curated OER
Fantasy Baseball Team
Young scholars create a database and use its ability to store, sort, and present information about their fantasy baseball team. They gather information and use their knowledge of statistics to accomplish their team.
Curated OER
introducing the Concept: Using Ratios and Percents
Young scholars convert decimals and fractions to percents. In this introductory percents instructional activity, learners work with equivalent fractions and learn to draw ratios. They recognize how to change a fraction to a percent.
Curated OER
Fantasy Basketball
Students play Fantasy Basketball in order to practice locating Internet information and using technology tools to display data; students demonstrate an understanding and use of graphing, probability, and statistics.
Curated OER
New Kids in The Hall
Students assess the role of statistics in determining those athletes chosen to be inducted into the Baseball Hall of Fame. They work in small groups to calculate, chart, and graph various statistics for different Hall of Fame members.
Curated OER
Data Analysis and Bias
In this probability and statistics worksheet, students determine when a collected data or a graph of the data could be biased. The one page worksheet contains four multiple choice questions. Answers are included.
Curated OER
Data collection and analysis
In this probability and statistics worksheet, students determine when a survey or collected data could be biased. The one page worksheet contains a combination of three multiple choice and free response questions. Answers are...
Curated OER
Cricket 2007
In this math and sports worksheet, students read and review the statistics from the performance of teams in the Cricket World Cup. They identify which team played the most matches and who won the most. Students also compare the...
Curated OER
Math: Collecting and Analyzing Date
Children count how many of an activity they can do in a row, such as ball tossing and record the date and count. Children track over a period of time and graph results.
Curated OER
Sonics Math
Young scholars multiply whole numbers by fractions. They see one way that decimals apply to the real world, and possibly consider more.
Curated OER
Math: How Many Ways Can You Find the Middle?
Twelfth graders find the mean, median, and modes of stacks of Lego blocks, They search in newspapers for real life applications of them. They present oral reports on what they have learned.
Visa
A Way to Wealth: Understanding Interest and Investments
Money motivates! Help young bankers understand how math plays a part in investing. Give learners math practice while instilling real-world financial literacy skills.
Curated OER
Literal Equations
Students explore Literal Equations. In this literal equations lesson plan, students use the Internet to connect to links and solve linear equations. Students investigate, analyze and record their findings on various activity worksheets.
Curated OER
Play Ball!
Young scholars pretend as if they have been hired by the commissioner of Major League Baseball. Their task is to explain the mathematics of baseball so that more people enjoy the game.
Curated OER
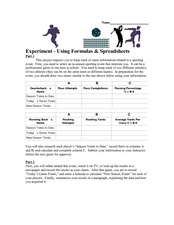
Experiment-Using Formulas and Spreadsheets
In this Algebra I worksheet, 9th graders track information relating to a sporting event and create a spreadsheet and appropriate formulas used to track data. The one page worksheet contains the assignment and...
Curated OER
Height versus Shoe Size
Students find a correlation between a person's height and his/her shoe size. They have access to entering data into lists on a graphing calculator and can complete scatter plots. Students read and interpret a scatter plot and use the...
Curated OER
The Bigger they Are . . .
Learners do a variety of data analyses of real-life basketball statistics from the NBA. They chart and graph rebounding, scoring, shot blocking and steals data which are gathered from the newspaper sports section.

