Curated OER
Fantasy Baseball Team
Young scholars create a database and use its ability to store, sort, and present information about their fantasy baseball team. They gather information and use their knowledge of statistics to accomplish their team.
Curated OER
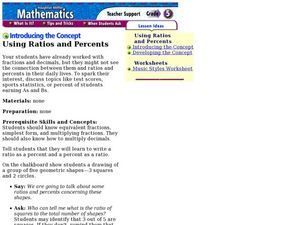
introducing the Concept: Using Ratios and Percents
Young scholars convert decimals and fractions to percents. In this introductory percents instructional activity, learners work with equivalent fractions and learn to draw ratios. They recognize how to change a fraction to a percent.
Curated OER
Fantasy Basketball
Learners play Fantasy Basketball in order to practice locating Internet information and using technology tools to display data; students demonstrate an understanding and use of graphing, probability, and statistics.
Curated OER
New Kids in The Hall
Students assess the role of statistics in determining those athletes chosen to be inducted into the Baseball Hall of Fame. They work in small groups to calculate, chart, and graph various statistics for different Hall of Fame members.
Curated OER
Math: Collecting and Analyzing Date
Children count how many of an activity they can do in a row, such as ball tossing and record the date and count. Children track over a period of time and graph results.
Curated OER
Sonics Math
Young scholars multiply whole numbers by fractions. They see one way that decimals apply to the real world, and possibly consider more.
Curated OER
Math: How Many Ways Can You Find the Middle?
Twelfth graders find the mean, median, and modes of stacks of Lego blocks, They search in newspapers for real life applications of them. They present oral reports on what they have learned.
Visa
A Way to Wealth: Understanding Interest and Investments
Money motivates! Help young bankers understand how math plays a part in investing. Give learners math practice while instilling real-world financial literacy skills.
Curated OER
Literal Equations
Students explore Literal Equations. In this literal equations lesson plan, students use the Internet to connect to links and solve linear equations. Students investigate, analyze and record their findings on various activity worksheets.
Curated OER
Play Ball!
Young scholars pretend as if they have been hired by the commissioner of Major League Baseball. Their task is to explain the mathematics of baseball so that more people enjoy the game.
Curated OER
Height versus Shoe Size
Students find a correlation between a person's height and his/her shoe size. They have access to entering data into lists on a graphing calculator and can complete scatter plots. Students read and interpret a scatter plot and use the...
Curated OER
The Bigger they Are . . .
Students do a variety of data analyses of real-life basketball statistics from the NBA. They chart and graph rebounding, scoring, shot blocking and steals data which are gathered from the newspaper sports section.
Curated OER
Equivalent Decimals
Students develop strategies to find equivalent decimals. In this equivalent decimals lesson, students participate in a variety of decimal games to find equivalent decimals.
Curated OER
Subtract Positive and Negative Integers
Review the concept of subtracting positive and negative integers. Learners review the rules for subtracting integers, use manipulatives to visualize the process, and complete an assessment.
Curated OER
You Be The Judge: Olympics, Winter Sports, Figure Skating, Math, Statistics, Technology
Middle schoolers design a score sheet for use when watching a figure skating performance. They use spreadsheet software and research information obtained on the Internet to create their score sheets.
Curated OER
Tracking Olympic Gold!
Students use print or online resources to track the results of the Olympic Games, record daily results on graphs, use graphs to collect information.
Curated OER
Graphs
Students list their favorite cars and create graphs of their favorites. Students determine how the graphs would change as their choices change.
Curated OER
Calculating Your Travel GHGs
Young scholars calculate the amount of greenhouse gases they produce in a given day. Using an equation, they determine the emissions for different sized vehicles and calculate the amount resulting from a family vacation. They create a...
Curated OER
The Basketball Tournament
Pupils estimate how many games are played if six teams play each other once. They investigate their own way and discuss possible strategies they might use. They then share their findings with the class.
Curated OER
And Around We Go!
Sixth graders conduct a survey and collect data to construct a bar graph that will then be changed into a circle graph. With the bar graph, 6th graders compare estimated fractions and percentages and estimate percentages. With the circle...
Curated OER
The Young Basketball Player
Students explore the history of basketball by reading and listening to a book entitled, "The Young Basketball Player." Afterwards, they create a trivia basketball game and write an interview for their favorite player. As a...
Children's Museum
The Children's Museum of Indianapolis: Sports Science and Wellness
This unit of study contains three lessons, each with three experiences that may be taught together or individually. Each lesson will connect to science and/or math standards, along with a health standard or sports connection.
Utah Education Network
Uen: What About That Jazz?
This lesson plan provides a lesson plan that highlights NBA's Utah Jazz team. Teachers will demonstrate how to use a database, and then students will engage in exploring the database of the Utah Jazz.
PBS
Pbs Teachers: Sports and Math: Batting Averages and More
Set up a spreadsheet using a computer or graphing calculator, and perform calculations using columns. Calculate percentages and solve a system of equations regarding baseball statistics.


