Hi, what do you want to do?
Curated OER
Making Sense of the Census
In this unit of lessons, learners make sense of the census. They examine why a census is taken and partipate in activities.
Curated OER
Up in Smoke
Students use PowerPoint, Internet research, scanners and desktop publishing to create a multimedia presentation on the dangers of smoking.
McGraw Hill
Glencoe Mathematics: Online Study Tools: Statistics and Probability
The online test demonstrates knowledge of the concepts used in Algebra I. The multiple choice questions assess students on statistics and probability. Topics include biases, samples, and surveys.
Other
U. Of Wisconsin: Formulating Statistical Questions and Collecting Data
This slideshow gives a detailed explanation of the characteristics of statistical questions and how they differ from other types of questions, the types of studies, and the methods for collecting data. It describes the case of Clever...
Khan Academy
Khan Academy: Statistical Questions
Practice spotting the difference between statistical and non-statistical questions. Students receive immediate feedback and have the opportunity to try questions repeatedly, watch a video or receive hints.
Oswego City School District
Regents Exam Prep Center: Statistical Studies, Central Tendency, and Dispersion
The mathematics tutorial investigates statistical studies, central tendency, and dispersion. The lesson consists of class notes, calculator tips, examples, and practice problems with solutions. The teacher resource includes an activity...
Annenberg Foundation
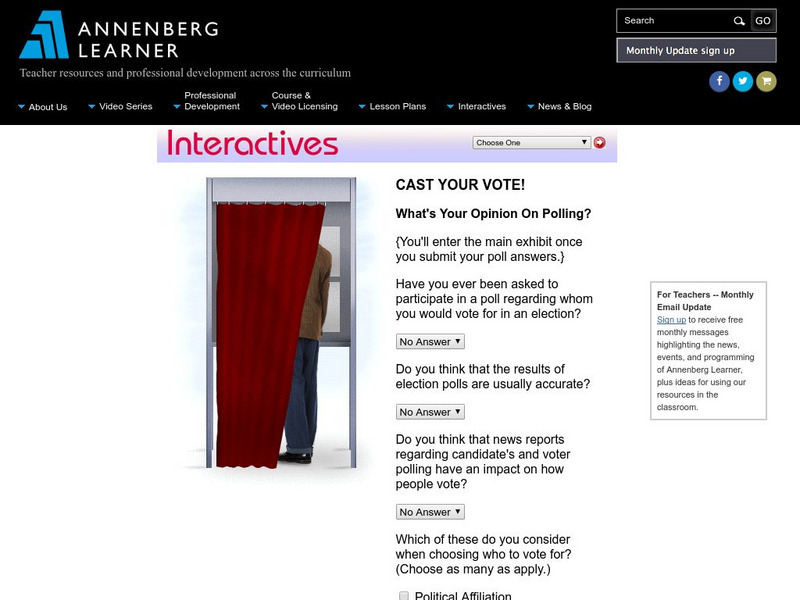
Annenberg Learner: Interactives: Cast Your Vote!
Upper elementary, middle, and high school students can use this exhibit to get an understanding of how polls and elections are conducted. The discussion includes random samples, margins of error, and other concepts related to statistics.
Math Is Fun
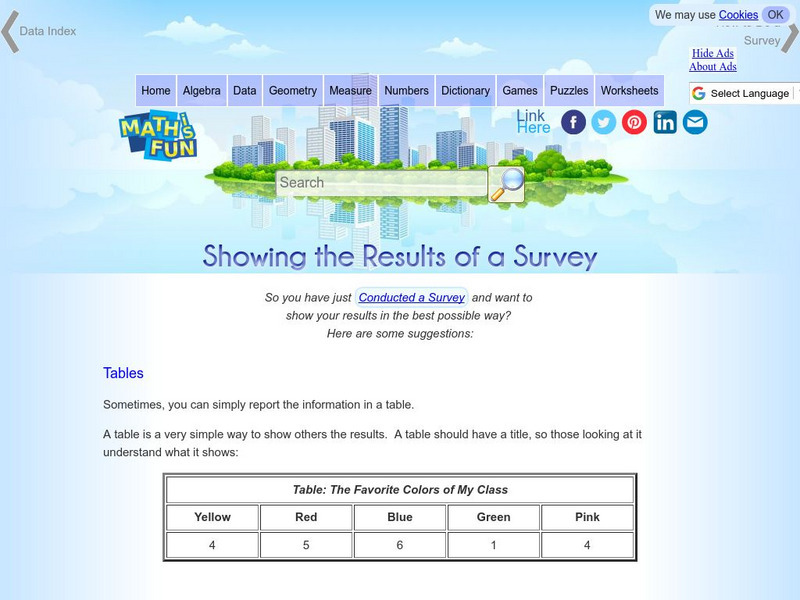
Math Is Fun: Showing the Results of a Survey
A variety of ways to display the results of a survey are listed, including tables, statistics and different types of graphs.
National Council of Teachers of Mathematics
The Math Forum: Data Collecting Project Stats Class
This lesson plan provides the teacher with all the necessary handouts and directions to give a statistics class when they are ready to complete a thorough survey project. Broken into five parts, it takes the young scholars through the...
US Department of Education
National Center for Education Statistics: Nces Classroom
Just what is the NCES Students' Classroom? In addition to many useful features, this site provides math and statistical activities tailored to a middle and elementary school students.
Alabama Learning Exchange
Alex: Ice Cream Sundae Survey
Students quickly realize the importance of learning how to read and find information in charts, graphs, and tables compared to finding the same information written in a paragraph. This is a fun, high energy lesson!This lesson plan was...
Khan Academy
Khan Academy: Samples and Surveys
When we collect data it's important to know what type of data we're collecting and how to collect it properly.
Khan Academy
Khan Academy: Identifying Bias in Samples and Surveys
Practice problems identifying bias.
Alabama Learning Exchange
Alex: Let's Make a Pie
The students will survey their classmates and construct circle graphs to display their results. Students will produce circle graphs using a compass and protractor, and then with an interactive computer program.This lesson plan was...
Cyberbee
Adventures of Cyberbee: Graphing
Teacher-directed lesson plan focusing on data analysis, graphing, and probability. Lesson includes a video and engaging spreadsheet activities.
Khan Academy
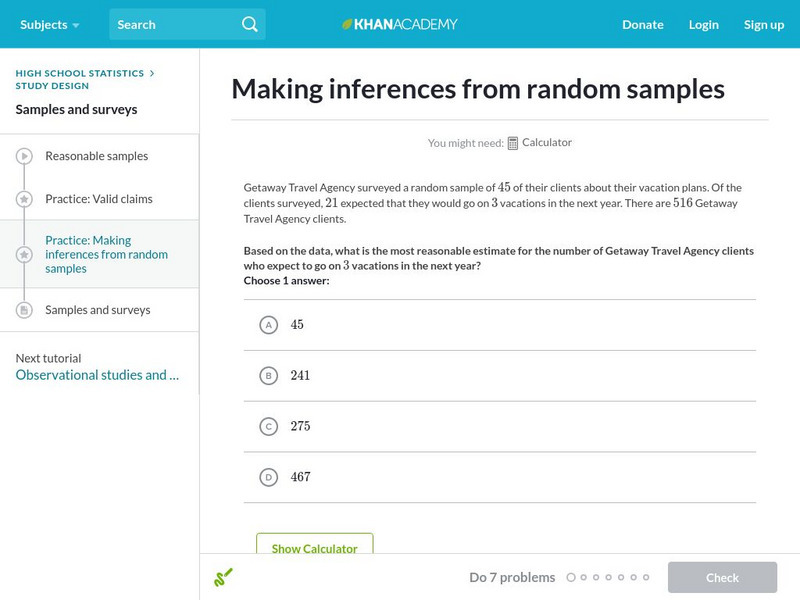
Khan Academy: Making Inferences From Random Samples
Given a random sample, practice figuring out what can we reasonably infer about the entire population? Students receive immediate feedback and have the opportunity to try questions repeatedly, watch a video or receive hints.


