Curated OER
Slopes for the Mathematically Inclined
In this slope worksheet, 9th graders solve and complete 6 different problems that include completing charts and applying applications to the real world. First, they use the pictures shown to measure the riser and tread of 3 consecutive...
Curated OER
Multiplication Chart
In this math instructional activity, students analyze four multiplication charts. Each chart is illustrated with a different cartoon character.
Curated OER
Hollie's Gigantic Garden
In this math puzzle activity, students put their problem solving skills to use as they fill in the plant growth charts that require them to write and solve equations.
Curated OER
Count By 3's
In this math worksheet, students practice counting by threes. Student fill in the missing multiples of three in three different hundreds charts.
Curated OER
Place Value
In this math worksheet, students complete nine place value charts. The place value charts include ones, tens, and hundreds places.
Curated OER
Flow Chart Secret Code: What Should You Call A Cow That Lives in Alaska?
In this math code worksheet, students solve 10 multi-step problems using all math operations. Students start with the given number and perform each step in a flow chart format. Students take their total answer and decode the secret message.
Curated OER
Frequency, Histograms, Bar Graphs and Tables
In this frequency instructional activity, students interpret histograms, bar graphs and tables. They examine frequency charts and comparison line graphs. This three-page instructional activity contains 4 problems. Answers are provided...
Curated OER
Froot Loops to the Max- Pie 2
In this Froot Loops to the Max worksheet, students solve 2 different problems related to graphing data with a box of Froot Loops cereal. First, they complete the circle/pie graph using the given data including a key and a title for their...
Curated OER
Flow Charts and Inverses
In this flow chart and inverse activity, high schoolers evaluate 6 equations and answer 12 questions. Students are asked to complete the flow chart and also its inverse; the outlines of both are provided.
Curated OER
Using Money Conversion Charts
In this money conversion worksheet, students convert money from US dollars to Euros, Australian dollars and Hong Kong dollars. This one-page worksheet contains 24 problems.
Curated OER
Math Club #7: Logic
In this logic worksheet, 8th graders work in groups to solve 8 math problems requiring critcial thinking skills.
Curated OER
Data Handling: Bus Charts
In this data display and analysis worksheet, learners study a bar graph that shows the number of people who ride the bus at different times of day. Students use the graph to solve 6 problems. Note: Bus times are shown in 24 hour clock time.
Curated OER
Addition Number Chart ( 1 to 10, No Clues)
In this math worksheet, students complete an addition chart with sums for 1 to 10. There are no clues on the chart. There is an animal graphic.
Curated OER
Direct Variation
In this direct variation worksheet, 11th graders solve 11 different problems that include applying direct variation to solve. First, they find the constant of the variation described. Then, students use the charts at the bottom of the...
Curated OER
Slumber Party
For this food worksheet, students pretend they are going to a slumber party and have to calculate food according to PKU. Students complete 7 questions and 2 charts.
Curated OER
Using A Table
In this table worksheet, middle schoolers observe information in a table, and then answer ten questions pertaining to the information. They must correctly read a table in order to arrive at the correct answer. Questions pertain to...
Curated OER
Weather Calendar
In this weather calendar worksheet, students read the calendar and identify the type of weather that occurred on that date. They also determine the total number of days that were cloudy, sunny, etc. There are 9 questions on this...
Curated OER
Temperature
In this temperature worksheet, students color a thermometer to depict the given temperature. They then compare, contrast temperatures and answer given thinking questions. There are approximately 20 questions on this one-page worksheet....
Curated OER
Problem Solving Involving Two People with Incorrect Watches
In this problem solving activity, students calculate what happens when two people plan to meet but their watches are wrong. The solutions with explanations is provided.
Curated OER
Cricket 2007
In this math and sports worksheet, students read and review the statistics from the performance of teams in the Cricket World Cup. They identify which team played the most matches and who won the most. Students also compare the...
Curated OER
Fine Arts in School
In this math chart worksheet, students use the chart to answer the questions. The information on the chart is about students who participate in fine arts.
Curated OER
Decimal Place Value Chart
In this decimal place value chart worksheet, learners work independently to fill in the blanks on the chart so that the numbers equal out correctly and the missing words are stated correctly.
Curated OER
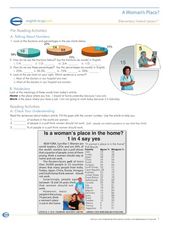
A Woman's Place?
In this women workers lesson, students read an article about women in the workforce and answer 10 questions related to the article. They also convert fractions to percentages.
Curated OER
Meatiest States: Graph Problem Solving
In this graph problem solving worksheet, students analyze a graph that shows commercial red meat production in five states. Students answer 5 word problems using the data on the graph.


