EngageNY
Constant Rate
Two-variable equations can express a constant rate situation. The lesson presents several constant rate problems. Pupils use the stated constant rate to create a linear equation, find values in a table, and graph the points. The resource...
Statistics Education Web
Saga of Survival (Using Data about Donner Party to Illustrate Descriptive Statistics)
What did gender have to do with the survival rates of the Donner Party? Using comparative box plots, classes compare the ages of the survivors and nonsurvivors. Using the same method, individuals make conclusions about the...
Curated OER
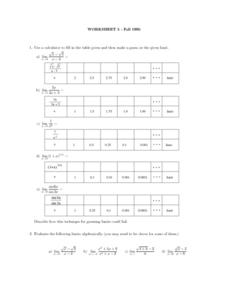
Worksheet 5: Property Limits and the Squeeze Theorem
In this math worksheet, students answer 6 questions regarding given limits in a table of data, properties of limits and the Squeeze Theorem.
Curated OER
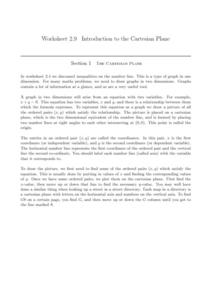
The Cartesian Plane
Learners solve and complete 22 various types of problems. First, they find the gradients of the lines and plot the given points. Then, they complete the table of values for each equation and use the table to draw the graph.
Houghton Mifflin Harcourt
Convert Customary Units of Length
Sports fans will really enjoy this unit conversion assignment. A table of standard measurements for football-related equipment is presented as the data for solving six word problems. For all of the problems, players will need to convert...
Curated OER
Worksheet 3.1 Functions
Middle and high schoolers complete and solve 12 various types of problems. First, they express the output as a function of the input in each table. Then, pupils evaluate for the given variable when the value is as stated. In addition,...
Old Dominion University
Introduction to Calculus
This heady calculus text covers the subjects of differential and integral calculus with rigorous detail, culminating in a chapter of physics and engineering applications. A particular emphasis on classic proof meshes with modern graphs,...
Howard County Schools
To Babysit or Not to Babysit?
Would you work for a penny today? Use this activity to highlight the pattern of increase in an exponential function. Scholars compare two options of being paid: one linear and one exponential. Depending on the number of days worked, they...
EngageNY
Understanding Box Plots
Scholars apply the concepts of box plots and dot plots to summarize and describe data distributions. They use the data displays to compare sets of data and determine numerical summaries.
EngageNY
Connecting Graphical Representations and Numerical Summaries
Which graph belongs to which summary statistics? Class members build upon their knowledge of data displays and numerical summaries to connect the two. Pupils make connections between different graphical displays of the same data in...
Noyce Foundation
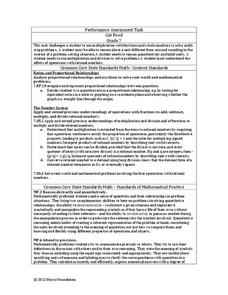
Cat Food
Determine the right mix of cans of cat food. The resource consists of an assessment task to determine the cost to feed two cats for a specific number of days and requires scholars to interpret remainders within a context....
Noyce Foundation
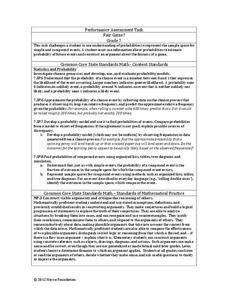
Fair Game?
The game should be fair at all costs. The mini-assessment revolves around the ability to use probabilities to determine whether a game is fair. Individuals determine compound events to calculate simple probabilities and make...
Yummy Math
Which is the Best Deal on Candy?
Buying enough candy for trick-or-treaters without spending a lot of money can be the ultimate Halloween trick. Middle schoolers solve two holiday-themed word problems to determine which brand of candy is the better deal, based on cost...
Achieve
Ground Beef
Ever wonder how a butcher creates the different types of ground beef? Young mathematicians explore the methods butchers use to create their desired ground beef quality. Given a combination of two types of meat with varying...
Curated OER
Frequency Table
In this frequency table worksheet, students create a frequency table from given data. They identify the mode. Students read and interpret frequency tables. This one-page worksheet contains 7 multi-step problems.
Curated OER
Toy Sale- Writing Number Sentence and Using a Data Table Enrichment Worksheet
In this number sentence and data table enrichment worksheet, 1st graders write a number sentence using information from a data table to solve an equation in 4 examples.
Curated OER
Graphing Information from a Data Table
In this graphing worksheet, students solve 12 problems in which data on a table is presented on a bar graph. This page is intended to be an online activity, but may be completed with paper and pencil.
Curated OER
Mean, Median, and Mode for Frequency Tables
In this mean, median, and mode activity, students solve 10 short answer problems. Kids find the mean, median, and mode of various data sets. Students make frequency tables from the data sets.
Curated OER
Number Search Y2 10x Table
In this multiplication fact practice worksheet, students solve a math puzzle that requires them to find the sums of 10 multiplication problems in a number search grid.
Illustrative Mathematics
Friends Meeting on Bicycles
It's a great day for a bike ride, but how long will it take? Your learners will have to calculate multiple variables in the problem using scaffolded questioning. Different answer choices are given, but you will need to create the table...
Curated OER
Function Tables
In this graphing learning exercise, students complete two different word problems by filling out the function tables and then writing an algebraic equation for the problems.
Curated OER
Multiplication Chart-Partially Filled
An excellent practice resource for helping students to master their multiplication skills. With 89 spaces missing from a 10x10 multiplication table, students must work to fill in the blanks and complete their multiplication chart. There...
Curated OER
Multiplication Facts to 144 No Zeros
Drill young mathematicians on their multiplication tables with this practice worksheet. Included on this worksheet are 100 multiplication problems with single and double-digit integers from one to twelve. No instruction or explanation is...
CCSS Math Activities
Social Security Trust Fund
Will Social Security still be around when you retire? Given data on the predicted balance of the social security fund over time, scholars plot the points on a coordinate grid and determine if a quadratic regression fits the data. They...
Other popular searches
- Math Tables and Tools
- +Math Tables Tips Tools
- Math Tables Tips Tools
- Math Tables and Graphs
- Making Math Tables
- Input/output Tables Math
- Learning Math Tables
- Math Tables Multiplacation
- Math Tables Multiplication
- Math Tables 3rd Grade
- Math Tables Predict
- Math Tables and Patterns


