Curated OER
Doubling and Halving
In this double the numbers and half the numbers worksheet, students problem solve by doubling, complete an input-output table by halving, and play a dice game and doubling the numbers. Students solve 28 problems.
Curated OER
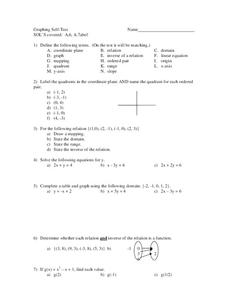
Graphing
For this graphing worksheet, 9th graders solve and graph 8 different problems that include defining various terms related to graphing. First, they label the quadrants in a coordinate plane and name the quadrant for each listed ordered...
Curated OER
Equations as Relations
In this equations as relations worksheet, 10th graders solve and graph 9 different problems that include determining various ordered pairs. First, they determine the ordered pairs that are solutions to each equation. Then, students solve...
Curated OER
Linear Equations
In this linear equations activity, 9th graders solve and complete 7 different problems that include a number of linear equations. First, they determine the slope given the points and then write an equation in slope-intercept form. Then,...
Curated OER
Relations and Functions
In this relations and functions worksheet, 11th graders solve and complete 10 various types of multiple choice problems. First, they use the same relation between two variables as the given table to determine the value of one variable...
Curated OER
Odd or Even (Sums and Differences)
In this math worksheet, students examine 14 problems inside geometric shapes. Students solve the simple addition or subtraction problems and color the shape blue if the answer is even and red if it is odd.
Curated OER
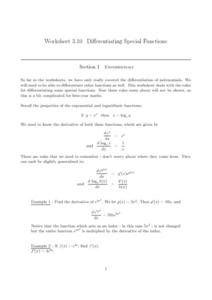
Differentiating Special Functions
In this differentiating special functions worksheet, students solve and complete 5 various types of problems. First, they differentiate each of the given functions. Then, students complete the table using a calculator and plot the points...
Curated OER
Direct Variation
In this direct variation instructional activity, students answer 4 multiple choice questions that involve identifying a direct and constant variation and writing the direct variation equation.
Curated OER
Using a Chart to Track Book Sales
On this using a chart to track book sales worksheet, students use the chart for 6 types of books sold over a 6 day period to answer 8 fill in questions about interpreting the chart.
Noyce Foundation
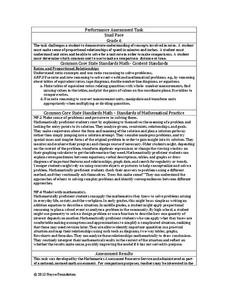
Snail Pace
Slow and steady wins the race? In the assessment task, scholars calculate the rates at which different snails travel in order to find the fastest snail. Hopefully, your class will move much more quickly in finishing the task!
Curated OER
Arithmetic Patterns
Pupils experience math functions as they practice their addition and subtraction skills, and fill in each table based on a given rule. There are two columns in each of the four tables. The in column is already completed and...
Curated OER
Place Value and Expanded Form
Because there is only one place-value problem here and a detailed explanation below, use this as an all-class warm up. Learners write 369 in expanded form with a little assistance by a place value table. They can fill in the hundreds,...
Curated OER
Arithmetic Patterns
When one number goes in, another comes out. Scholars are introduced to math functions as they multiply, subtract, and divide numbers to get new ones. There are three functions and tables of numbers here; pupils apply the rule to each...
Curated OER
Make Your Own
Your first and second graders will categorize hearts, triangles, and stars, putting them in a picture graph. After the shapes are organized, they compare the number of each using the sentence frames provided.
Curated OER
Probability - Worksheet
Middle schoolers solve and complete four various types of problems. First, they list all the possible orders completed. Then, pupilscomplete the table and show all the outcomes of throwing a coin and spinning a spinner. They also use a...
Curated OER
Circle Graphs
In this circle graphs worksheet, learners solve and complete 8 different problems that include word problems referring to two different circle graphs shown. First, they follow the directions for each problem and complete the table that...
Curated OER
Twenty-Seven Graphing Lines, Parabolas, and Absolute Value Problems
Have learners find coordinates of point on a graph, find equations of graphs given, and graph given equations using in and out tables. There are 27 problems related to equations for lines, parabolas, and absolute value functions.
Curated OER
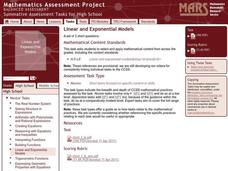
Linear and Exponential Models
Linear or exponential, see if your class can tell the difference. This very basic worksheet looks at different representations including tables of values, graphing, and an equation to assess understanding. This would make a good warm-up...
Curated OER
Regular & Irregular Polygons
In this polygons worksheet, 7th graders identify and complete 8 different problems that include determining the types of various polygons. First, they use the table to the left to color each of the polygons illustrated. Then, students...
Curated OER
Measurement: Perimeter
In this perimeter worksheet, 10th graders identify and complete 9 different problems that include determining the perimeter of various figures. First, they complete the table by writing the number of sides in each figure listed on the...
Curated OER
Generate Measurement Data Word Problems
Plot data for three word problems, each with a table of data. Learners create line plots for these, all of which have only single-digit whole numbers. The large text and few number of problems make this ideal as a whole-class warm up....
Illustrative Mathematics
Video Streaming
Your movie fans will be interested in this resource. They will compare video streaming plans. One plan charges a set rate per month and a reduced viewing fee, and the other has a flat rate per each video viewed. Unfortunately, students...
Illustrative Mathematics
Estimating Square Roots
No calculators! Assure your learners that they can find the square root of a large number. All they need are two known squares close by and a table. Come up with an additional practice and your number crunchers will have it mastered in...
Illustrative Mathematics
Equations of Lines
The intent of this resource is to show algebra learners that there is a proportional relationship between two lines that have an intersecting point. As the coordinate x increases by a constant, the y coordinate also increases. It...
Other popular searches
- Math Tables and Tools
- +Math Tables Tips Tools
- Math Tables Tips Tools
- Math Tables and Graphs
- Making Math Tables
- Input/output Tables Math
- Learning Math Tables
- Math Tables Multiplacation
- Math Tables Multiplication
- Math Tables 3rd Grade
- Math Tables Predict
- Math Tables and Patterns

