Curated OER
Angles and Arcs
In this angles and arcs worksheet, 10th graders solve 18 various types of problems related to determine various angles and arcs of a circle. First, they find the measure of each angle and arc of the first circle shown. Then, students...
Curated OER
Graphing
In this graphing worksheet, students solve and complete 8 different types of problems. First, they graph each set of axes completely. Then, students label the axes and shown a table of their results. In addition, they determine the cycle...
Curated OER
Graphing Equations
In this graphing equations on a grid learning exercise, students solve 10 problems. Students find the value of y for the value of x in the equations. Students make a table of ordered pairs and graph them on a grid.
Curated OER
Smarties Pictogram and Bar Chart
In this math worksheet, students create a bar chart to illustrate the number of Smarties they have in each color. Students also draw a pictogram to represent the same information.
Curated OER
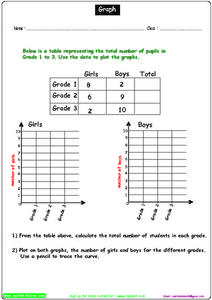
Graph Activity
In this graphing worksheet, students complete a data table, then use the data to draw a set of 2 graphs, calculate totals and plot numbers on both graphs.
Curated OER
Non Calculator Simultaneous Equations
Eighth and ninth graders combine pairs of linear equations by multiplying and either adding or subtracting. They find the value of x in the pair of equations. They use substitution to find the value of y. Students use graphing to solve...
Curated OER
Graphing Square Root
In this algebra worksheet, students graph square root functions. They use translation to move the graph around. There are 4 questions with an answer key.
Curated OER
Graphing Linear Equations
In this math worksheet, students practice graphing the linear equations on the Cartesian plane. They also create a function table for each.
Curated OER
Graphing Polar Equations
In this graphing polar equations learning exercise, students solve and complete 10 various types of problems. First, they construct a table of values using the special angles and their multiples. Then, students plot the points in the...
Curated OER
Worksheet 15-Fall 1995
In this math worksheet students use the intermediate value theorem to solve two problems. They find parallel lines that will cut a convex shape into two pieces with equal areas. Students repeat this problem with a concave shape. Students...
Curated OER
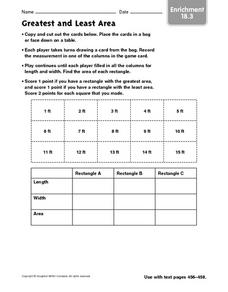
Greatest and Least Area - Enrichment 18.3
In this greatest and least area game worksheet, learners cut out the cards, draw a card and record the measurement in the length or width column of a graph. When all columns have been filled, they calculate the areas to find the winner...
Curated OER
Rational Functions and Their Graphs
In this Algebra II worksheet, 11th graders examine the graphs of rational functions, identifying the points of discontinuity and the vertical and horizontal asymptotes. The three page worksheet contains explanation of topic,...
Curated OER
Woodland Math Facts
In this Woodland math facts worksheet, students study and examine woodland weights of trees and shrubs, explore invertebrates and draw a bar chart to chart their findings.
Curated OER
4th Grade Math Quiz
In this grade 4 math quiz activity, 4th graders complete a 15 question multiple choice quiz covering a variety of grade 4 concepts.
Curated OER
Data Handling
In this data handling worksheet, students interpret data found in table, graphs and charts. They organize data and draw bar charts. This two-page worksheet contains 2 multi-step problems.
Curated OER
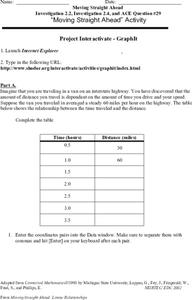
Moving Straight Ahead
In this functions worksheet, 9th graders solve and complete 24 various types of problems. First, they complete the table with the correct distance for each hour given. Then, students enter the coordinate pairs into the function table...
Raytheon
Data Analysis and Interpretation
For this data analysis and interpretation worksheet, learners use charts, graphs, statistics to solve 42 pages of problems with answer key included.
Curated OER
Basic Algebra and Graphing for Electric Circuits
In this electronics activity, students evaluate mathematical expressions to complete 16 short answer and problem solving questions.
Curated OER
Animal Runners
In this collecting data instructional activity, 4th graders use the data shown on how fast 6 animals can run to create a bar graph. Students follow the instructions on 3 directives for their bar graphs and answer 1 short answer question.
National Council of Teachers of Mathematics
Do I Have to Mow the Whole Thing?
In this mowing worksheet, learners find the area of given rectangles. They determine the combinations of lengths and widths that generate a given area. Learners graph given points. This two page worksheet contains sixteen multi-step...
Curated OER
Scatter Plots
In this statistics worksheet, 11th graders analyze different scatter plot graphs for positive, negative and no correlation. They graph their data and analyze it using scatter plots.There is 1 question with an answer key.
Curated OER
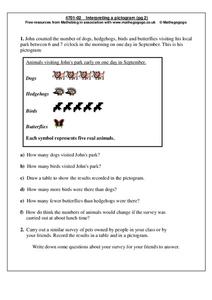
Interpreting a Pictogram
In this pictogram activity, students read and analyze a pictogram about dogs, hedgehogs, birds and butterflies and then answer 6 short answer questions. Students conduct a similar survey on pets owned by their friends and put their...
Curated OER
Froot Loop Favorites
In this Froot Loop favorites worksheet, students solve and complete 3 different problems that include data tables related to their Froot Loop favorites. First, they determine what fraction of the class voted for each color listed in the...
Curated OER
Graph Functions: Practice
For this graph functions worksheet, learners complete several activities to help them graph functions. Students use the table and the graph to complete the questions. Learners also answer two test prep questions.


