Curated OER
Conic Sections Applications and Properties
In this algebra worksheet, 11th graders graph parabolas and figure out the major axis and minor axis of the graph. They also find the focus. There are 4 problems on this worksheet.
Curated OER
Systems of Equations
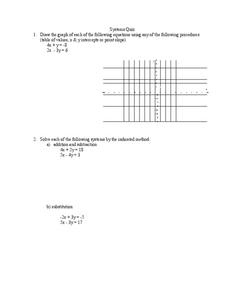
In this algebra worksheet, learners solve systems of equation through graphing, linear combination and substitution. There are 3 questions.
Curated OER
Snapping Your Fingers
In this algebra worksheet, students calculate how many snaps is done over a certain amount of time. They chart and graph their data. There is an answer key.
Curated OER
The 100 Meter Race Problem
For this meter worksheet problem, students read a word problem and interpret a graph. They use the derived information to determine time and distance. This one-page worksheet contains 1 multi-step problem. Answers are...
Curated OER
Maxima and Minima
In this algebra instructional activity, students discuss the origin of maxima and minima. They solve problems using the maxima and minima and graph parabolas and other functions containing a maxima and minima.
Curated OER
Worksheet 10, Functions and Inverses of Functions
In this algebra worksheet, students find the domain and range of composite functions. They use graphics from an unspecified text to create the graph of the inverse of the drawn function.
Curated OER
Place the First Digit
In this math graphs worksheet, students use the table for the 'States with the Fewest Full-Time Firefighters' math table to find the first digit value places for the word problems.
Curated OER
Binary Operations
In this binary operations worksheet, 9th graders solve 12 different problems related to various binary operations. First, they determine whether the operation is commutative. Then, students name the identity element and explain why none...
Illustrative Mathematics
Downhill
A car traveling down a steep hill is the model for this resource. The confusion comes when the elevation, E, is given in terms of distance, d. The distance, d, is the horizontal distance from E. Therefore, the equation, E = 7500 – 250d,...
Curated OER
Measures of Center
For this statistics worksheet, students find mean, median, and mode for 3 problems. They find the mean of summarized data in 2 problems.
Curated OER
Holiday Tally
In this tally chart worksheet, students ask ten friends which of 3 holidays they like best. Students create a tally chart with their results and answer 6 questions.
Curated OER
Algebra 1: Unit 5 Review
In this problem solving activity, 6th graders determine if 4 functions are exponential growth or decay, sketch 4 graphs and compare 2 sets of functions. Students write the rule, linear or exponential, for 4 tables.
Curated OER
Easy Worksheet: Domain and Range
In this domain and range worksheet, students solve 4 short answer problems. Students find the domain and range of various functions given an equation, table of values, or graph.
EngageNY
Comparison Shopping—Unit Price and Related Measurement Conversions
Speed up your scholars' understanding of ratios. Class members compare ratios related with speeds presented in different representations. They then use the unit rates to make the comparisons.
EngageNY
Comparison Shopping—Unit Price and Related Measurement Conversions II
Which rate is greater and by how much? Pupils continue to compare rates to solve problems in the 20th portion of a 29-part series. Rates are presented in a variety of representations either using the same representation or different...
Inside Mathematics
House Prices
Mortgages, payments, and wages correlate with each other. The short assessment presents scatter plots for young mathematicians to interpret. Class members interpret the scatter plots of price versus payment and wage versus payment for...
Curated OER
Use Fractions to Compare
In this fractions worksheet, students use 3 circle graphs to complete 3 tables, then answer 3 questions, using the graphs to compare information in tables. Answers available on page 2.
Virginia Department of Education
Linear Modeling
An inquiry-based algebra activity explores real-world applications of linear functions. Scholars investigate four different situations that can be modeled by linear functions, identifying the rate of change, as well as the...
Curated OER
Numerical Integration
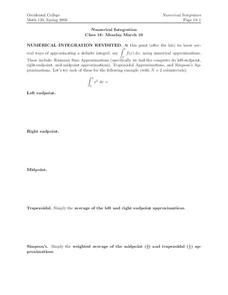
In this math activity, students practice using the number approximations to apply them to the integrations. They compare the numerical methods and graph the results in the data table.
Curated OER
Relations
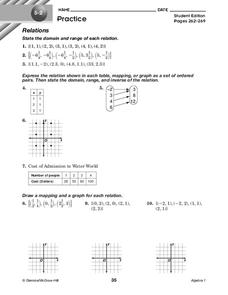
In this relations worksheet, 10th graders solve and complete 10 different problems that include defining various forms of relations. First, they state the domain and range of each relation. Then, students express the relation shown in...
Curated OER
Algebra II Calculator Lab
In this quadratic functions instructional activity, students use their graphing calculators to solve the 9 problems on the page. The questions ask students to graph functions, compare graphs, find the vertex and axis of symmetry and more.
Virginia Department of Education
Quadratic Equations
Review the multiple methods of solving quadratic equations through an analysis of the discriminant. Scholars use the discriminant to determine the best solution method and then solve various equations. As a challenge, learners build...
Curated OER
Solve a System of Inequalities
In this system of linear inequalities worksheet, students solve 5 problems with the graphing method and are given 2 examples with multiple steps to follow.
Noyce Foundation
Sewing
Sew up your unit on operations with decimals using this assessment task. Young mathematicians use given rules to determine the amount of fabric they need to sew a pair of pants. They must also fill in a partially complete bill for...


