Curated OER
Bungee M&M's
Science is exciting - and delicious! Pairs of learners set up a bungee cord type of experiment. They use buckets filled with M & M's, a meter stick, and a Slinky spring (as the bungee) to conduct their experiment. A good activity...
Curated OER
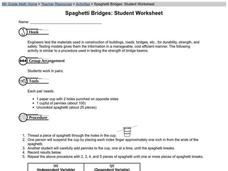
Spaghetti Bridges: Student Worksheet
Pairs of learners work together in order to simulate how engineers test materials for strength and safety in the real world. They use paper cups and pieces of spaghetti to run strength tests. This excellent instructional activity should...
Curated OER
Access Ramp
Just about every public building that your students are familiar with has an access ramp which complies with ADA requirements. As it turns out, designing such a ramp is an excellent activity to incorporate slope, the Pythagorean Theorem,...
Bowland
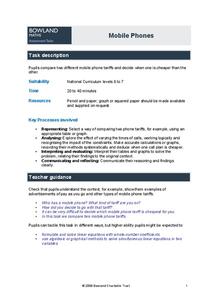
Mobile Phones
Cheaper cell phone bills? Learners compare two different cell phone plans for a specified number of minutes of phone usage each day. They also determine the conditions for which one plan is cheaper than the other.
EduGAINs
Data Management
Using a carousel activity, class members gain an understanding of the idea of inferences by using pictures then connecting them to mathematics. Groups discuss their individual problems prior to sharing them with the entire class....
California Education Partners
Least and Greatest
Squares can be magic. Pupils use their knowledge of addition of positive and negative rational numbers to create a 3 X 3 magic square where the sums are 1. Scholars create addition and multiplication expressions with a set of rational...
California Education Partners
Miguel's Milkshakes
Moooove over, there's a better deal over there! The fourth segment in a series of eight requires individuals to determine the best unit cost for milk. Scholars calculate the least amount they can spend on a particular quantity of...
California Education Partners
Yum Yum Cereal
Design an efficient cereal box. Scholars use set volume criteria to design a cereal box by applying their knowledge of surface area to determine the cost to create the box. They then determine whether their designs will fit on...
California Education Partners
Summer Olympics
Quickly get to the decimal point. The last assessment in a nine-part series requires scholars to work with decimals. Pupils compare the race times of several athletes and calculate how much they have improved over time. During the second...
California Education Partners
Cady's Cats
How much can a cat eat? The five-question fraction assessment asks pupils to determine the fractional portion of a food box eaten by cats. Learners show their proficiency in adding and subtracting fractions using several scenarios...
Curated OER
Numeracy Practice- Going Out For Lunch
In this math learning exercise, students complete the various types of activities that include graphs, data tables, and completing number sentences.
Curated OER
Commercial Salmon Fishing
Students work with data about commercial fishing ofsalmon in Alaska. Students gather data, graph it, and analyze it.
Curated OER
Counting Squares
In this counting squares worksheet, students solve 2 problems that include counting 2 different sets of squares. First, they draw a picture of four squares arranged in two rows of two. Then, students determine the total number of squares...
Curated OER
Fine Arts in School
In this math chart worksheet, students use the chart to answer the questions. The information on the chart is about students who participate in fine arts.
Curated OER
Linear Functions
In this linear function worksheet, 6th graders solve and complete 3 various types of problems. First, they write the equation of a straight line that passes through a pair of points. Then, students complete each table by filling in the...
Curated OER
New York State Testing Program: Mathematics Book 2, Grade 5
In this 5th grade math standardized test practice learning exercise, students solve 7 multiple-step open-ended math problems based on New York academic standards.
Curated OER
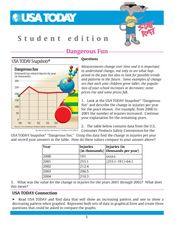
Dangerous Fun
In this line graph activity, students analyze the data on a graph about toy-related injuries by year. Students solve 5 problems in which the change in injuries per year is calculated and recorded on a table.
Curated OER
Systems of Linear Inequalities
In this Algebra I/Algebra II worksheet, learners solve systems of linear inequalities by graphing the inequalities on a coordinate plane and determining the location of all ordered pairs that solve the system. The three page...
Curated OER
Senior Analysis
In this senior analysis worksheet, students solve and complete 10 various types of problems. First, they graph each function completely. Then, students label the axes and show a table for each. They also determine if the graph is a...
Curated OER
Integration: Statistics, Scatter Plots and Best-Fit Lines
In this math worksheet, students identify the type (if any) of correlation on 6 scatter plots. They use information given on a table to create a scatter plot and identify the type of correlation. Students use the scatter plot to make...
Curated OER
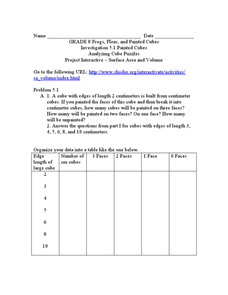
Analyzing Cubes
In this analyzing cubes worksheet, 9th graders solve and complete 6 different types of problems. First, they organize the given data into the table provided. Then, students study the patterns in the table and tell whether the pattern of...
Curated OER
Lab Sheet: Exponential Growth and Decay
In this exponential worksheet, students gather information from an experiment and plot the data in a scatter plot. Using given formulas, they plot an equation of a line and then compare the graphs. Students observe exponential growth...
Curated OER
Quadratic Review
In this quadratic review worksheet, learners work with an overview on how to solve and graph quadratic equations. Twelve fully worked examples are shown.
Curated OER
Let's Flip a Coin
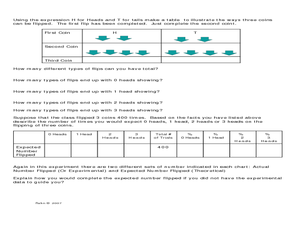
In this probability instructional activity, students use a TI graphing calculator to simulate flipping a coin and compare their results (experimental probability) to the expected results (theoretical probability). The five page...

