California Education Partners
Speedy Texting
Model the effects of practice on texting speed. Pupils develop a linear equation that models the change in texting speed based on the amount of practice. The sixth performance task in an eight-part series requires learners to solve...
Ohio Literacy Resource Center
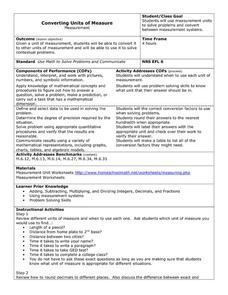
Converting Units of Measure
Follow six steps to implement this series of metric worksheets. Here, mathematicians exhibit their knowledge of problem solving, while converting units of measurement and label their answers with the applicable unit name.
Achieve
Corn and Oats
How much land does a parcel hold? How much fertilizer does it take for a field of corn? Pupils answer these questions and more as they apply ratio reasoning and unit analysis.
Statistics Education Web
The Case of the Careless Zookeeper
Herbivores and carnivores just don't get along. Using a box of animal crackers, classes collect data about the injury status of herbivores and carnivores in the box. They complete the process of chi-square testing on the data from...
Curated OER
Histograms and Statistical Graphics
In this statistics worksheet, young scholars solve 6 data problems. They construct a histogram of given data, they create a frequency polygon, and a stem and leaf diagram. Students create a dot plot and a pie chart for given data sets....
Curated OER
Data and charts
In this data and charts worksheet, students answer multiple choice questions referring to different charts about mountain heights, breakfast drinks, and more. Students complete 10 multiple choice questions.
Curated OER
Integrated Algebra Practice: Histograms
In this histogram worksheet, students solve 6 multiple choice and short answer problems. Students read histograms and determine the frequency of a particular item.
Curated OER
Collecting Data
In this data collection worksheet, students read about how data is collected and organized. They also learn about a hypothesis. Students read through examples of different charts and then answer 23 questions pertaining to data...
Curated OER
Applications of Parabolas
In this algebra worksheet, 11th graders rewrite word problems using algebraic symbols. They relate parabolas to the real world and calculate the breaking distance using the distance formula they come up with. There is answer key.
Curated OER
Data Handling: Tally Chart on Illnesses
In this tally chart worksheet, learners analyze a chart showing childhood illness cases. Students use the tally chart to solve 6 problems.
Curated OER
Integrated Algebra Practice: Box and Whisker Plots
In this box and whisker plot worksheet, students solve 5 short answer problems. Students use box and whisker plots to describe data and determine what percentile a piece of data belongs.
Curated OER
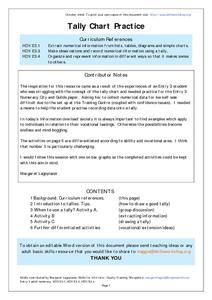
Tally Chart Practice
In this tally chart worksheet, students will read about tally charts and their uses. Students will make a list of when and why they could make a tally chart. Next students will complete a tally chart and write statements about the...
Curated OER
Favorite Pets
In this tally chart worksheet, learners finish filling in a chart involving a survey of favorite pets from a particular class. Students then answer 4 short answer questions about the results of the survey.
Curated OER
Tally Chart: Favorite Names
For this data display worksheet, students analyze a tally chart of favorite hamster names. Using the information on the chart, students solve 8 word problems.
Curated OER
Surface Area of a Leaf (Grades 7-9)
In this math and science activity, learners read about the process of photosynthesis and plant growth. They determine how a plant's ability to create food is dependent on the surface area of its leaves using geometric calculations. They...
Curated OER
Estimating Pi as a Length
In this pi learning exercise, students evaluate the curve of a quarter of a circle. They analyze the length of the curve, and explain that if the area under the curve is equal to pi, the length of the curve above is also equal to pi....
CPM
Unit 3, Worksheet 1, Exponents and Algebraic Expressions
Need exponentt practice? Then this exponent worksheet will be helpful to have learners evaluate exponent expressions and algebraic expressions. They use the distributive property to solve equations. This three-page worksheet contains...
Curated OER
Exploration 1: Instantaneous Rate of Change Function
In this function activity, students read word problems and write functions. They determine the instantaneous rate of change and identify intervals. This three-page activity contains approximately 20 problems.
Curated OER
Exploring Similarity Using Scale Drawings
Learners explore scale factor as they create a scale drawing of a box, then determine the surface area and volume of the original and the scale drawing. The one page worksheet contains activities and procedures with four questions....
Curated OER
Geometric Coordinates
In this geometric coordinates instructional activity, students solve and complete 3 different types of problems. First, they use the equations provided to complete the table on the right. Then, students plot the x- and y- coordinates on...
Curated OER
Pond Theme Unit
In this pond theme worksheet students research facts on pond life. Students complete comprehension questions, crosswords, word search, and math puzzles. Students write a short report.
Special needs in Music
Music Work Sheet (Special Ed)
Music is beneficial for all learners. Help your learners with special needs learn about different styles of music, as well as the ways that music is represented on paper, with 30 different worksheets.
Curated OER
Limits
In this limit worksheet, students evaluate functions and determine the limits of the function. This one-page worksheet contains 10 problems.
Curated OER
Penny Toss - Exponential Growth and Decay
In this penny toss worksheet, students collect statistical data by tossing pennies and then create a scatter plot of the data. They use formulas for exponential growth and decay and then plot the function. This two-page document...


