Curated OER
The Race of Baseball All-Stars
Collect and analyze data. Pupils graph their data and model with it to solve real life problems. They use logic and deductive reasoning to draw conclusions.
Curated OER
How Deep Do They Dive
Students calculate and graph the diving depths of various types of whales. They cut out and glue whale pictures on a worksheet to represent the diving depths for five whales, and discuss how people use graphs to communicate.
Curated OER
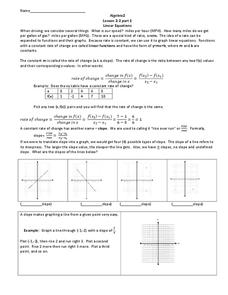
Linear Equations
Pre-algebra pupils examine the rate of change and how we can interpret it as a linear function. They are introduced to slope-intercept equations and graphs. Plenty of instruction is provided along with example problems. Note that even...
Virginia Department of Education
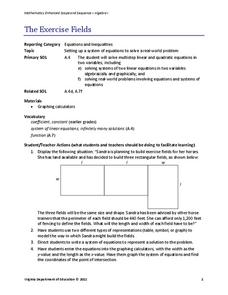
The Exercise Fields
Horses need exercise, too. Scholars create linear equations to model the perimeter of exercise fields for horses. They finish by solving their equations for the length and width of the fields.
Curated OER
Fabulous Fractals
Students view a video to discover how patterns in nature relate to math. They explore the concept of exponential growth by observing and creating fractals. They solve and design word problems.
Curated OER
Data Analysis: For Little Learners
Using pictographs, tally charts, and surveys, kids learn all about data analysis and collection. They make surveys, collect data, then construct pictographs and tally charts to organize their information.
Curated OER
Excel Lesson Plan Coin Statistics
Second graders determine the difference between making a prediction and determining actual information. They design a spreadsheet for a coin flipping activity on which they include their predictions and what actual happens when they flip...
Curated OER
Death by Particles
Emerging epidemiologists define relative risk and read an article about the effect of particulate pollution on the cardiovascular health of women. They record the relative risk values, graph them, and answer analysis questions. This is a...
Curated OER
Who Shares My Function?
Young scholars differentiate between linear and quadratic functions. In this algebra lesson plan, students write equations of graphs and graph a function from an equation. They also move the graph around on the coordinate plane.
Illustrative Mathematics
Equations of Lines
The intent of this resource is to show algebra learners that there is a proportional relationship between two lines that have an intersecting point. As the coordinate x increases by a constant, the y coordinate also increases. It will...
Illustrative Mathematics
Do You Fit In This Car?
A short activity that focuses on the normal distribution as a model for data distribution. Using given means and standard deviations, your budding statisticians can use statistical tables, calculators, or other statistical software to...
Curated OER
Why Doesn't My New Shirt Fit?
Pupils test Leonardo da Vinci's view of the human body by measuring various body parts using a tape measure. They create a data table and a scatter plot and then analyze and interpret the results using a graphing calculator.
Curated OER
Grab the Candy Hearts
For this candy activity, learners play the game Grab the Candy for Valentine's Day where they roll dice to find ordered pairs on a graph and place the candy inside that square. Students play until all candy is gone and use the scoring...
Curated OER
Equations from Unit Rates
Your class can become linear equations masters, as they calculate the rate of change of a function. They observe different types of coordinates as they relate to a graph, then use the Ti-navigator to move the line around and draw...
Curated OER
Fractions and Measurement
Using a Smart Board, or a plain ol' white board or chalkboard, the teacher pulls up a grid and demonstrates how squares and rectangles can be divided up into equal parts. The class will get their own graph paper to draw shapes and divide...
Curated OER
Collect and Organize Data - Practice 14.1
In this data collection worksheet, students read the word problem and study the tally chart about favorite sports. Students then use the information in the chart to answer the questions. Students then use the list about students'...
Curated OER
Hypothesis Testing
Students investigate the finding of a hypothesis and how it can be tested.For the experiment they will be using the concept of probability. Students design an experiment and test the hypothesis. Then the results are graphed showing the...
Curated OER
Relations
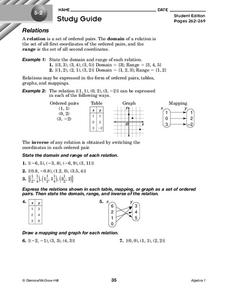
In this relations learning exercise, 10th graders solve and complete 7 different problems that include defining various relations of number sets. First, they state the domain and range of each relation. Then, students express the...
Curated OER
Organising Data
Students complete data organization activities. In this data organization lesson, students watch online clips about organizing data. Students complete an eye color frequency table for their class. Students watch a clip about asking...
Curated OER
Ice Cream Scoop
In this data display worksheet, students write 6 flavors of ice cream on pieces of paper. Students choose papers one at a time and keep track on a tally sheet. Students make a bar graph of the results.
Curated OER
Science and Technology
Students research inventions that have been created. In this historical technology instructional activity, students read the Harcourt Brace social studies textbook and discuss how inventors used graphs to display data. Students create a...
Curated OER
Too Many Tulips
In this graphing information worksheet, students read 6 sentences and then fill in the chart with the appropriate information from the sentences.
Curated OER
Positive Future Fair Project
Ninth graders view the film "Pay It Forward" and discuss what kind of public campaign is needed to move people to positive action. They consider different ways of presenting information (graphs, visual displays, etc.) as tools for...
Curated OER
Statistics
In this statistics worksheet, students solve 2 problems that involving plotting data, recognizing ordered pairs, and analyzing the graphed relationship.


