Hi, what do you want to do?
McGraw Hill
Glencoe: Self Check Quizzes 1 Using Graphs to Make Predictions
Use Glencoe's randomly generated self-checking quiz to test your ability to use graphs to make predictions. Each question has a "Hint" link to help. Choose the correct answer for each problem. At the bottom of the page click the "Check...
Other
The Actuarial Foundation: Math Academy: Can You See It in Nature? [Pdf]
Young scholars will build, extend, describe, predict, graph and generate rules for patterns and functions designed to help students understand the connection between geometric and numerical patterns (younger young scholars) as well as...
CK-12 Foundation
Ck 12: Algebra: Using Functions to Describe a Situation
[Free Registration/Login may be required to access all resource tools.] Students learn to write a function rule from a table of values and represent real-world situations with a function. Students examine guided notes, review guided...
Rice University
Rice University: The Hand Squeeze
Students will enjoy this data collection and class analysis experiment involving the time it takes for a hand squeeze to travel around a circle of people. From organizing the activity to collecting the data to making a table and graphing...
Other
Desmos: Charge!
In this interactive application of linear modeling, students make a prediction about the length of time it would take to charge a smartphone. They then work through a series of steps where they sketch their prediction, extend a table of...
Illustrative Mathematics
Illustrative Mathematics: F Le Choosing an Appropriate Growth Model
The goal of this task is to examine some population data for large cities from a modeling perspective. Students are asked to decide if the population data can be accurately modeled by a linear, quadratic, and/or exponential function, and...
Illustrative Mathematics
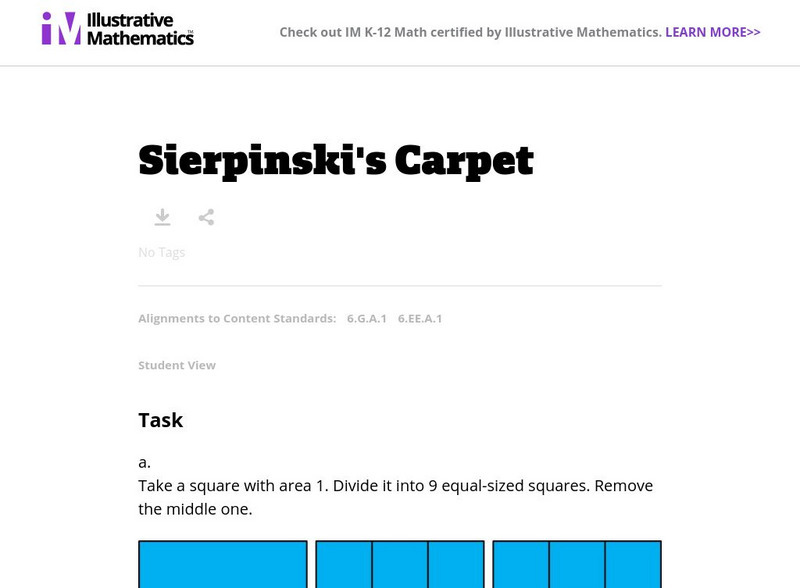
Illustrative Mathematics: 6.ee,g Sierpinski's Carpet
In this task, 6th graders are presented with a large square divided into 9 squares and the center square is then removed. They are asked to find the area of the 8 remaining squares. Each smaller square is divided in the same way and the...
University of Cambridge
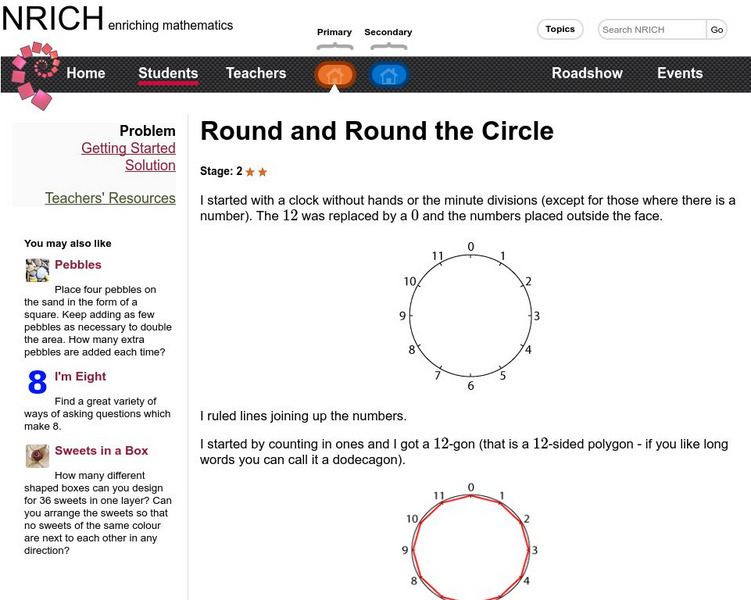
University of Cambridge: Nrich: Round and Round the Circle
Learn multiplication with this dial star exercise. Predict what shapes you will get with different numbers.
PBS
Pbs: Cooking With Bill Nye: Dependent and Independent Variables
Making dinner become a math challenge and science experiment with Bill Nye. This interactive exercise focuses on using what you know about dependent and independent variables to make a prediction about whether boiling water with the lid...
PBS
Pbs: Ditch Digger: Coordinate Pairs
Figure out whether two ditch diggers are digging in a single line. This interactive exercise focuses on using what you know about rate of change and lines to make a prediction about whether two lines will intersect and then requires...
PBS
Pbs: Comparing Powers of 10
Use powers of 10 to investigate scientific notation. This interactive exercise focuses on using what you know about rate of change and lines to make a prediction about whether two lines will intersect and then requires completing the...
PBS
Pbs: Shower vs. Bath: Ratio and Rate
Compare the cost of taking a shower with the cost of taking a bath. This interactive exercise focuses on using what you know about ratios to make a prediction about whether a shower or a bath is most cost effective and then requires...
PBS
Pbs: Toothpicks: Patterns in Geometric Shapes
How can you describe the pattern made by a growing triangular shape? This interactive exercise focuses on using what you know about pattern recognition and completing a table so you have data you can use to graph the coordinates on a...
Alabama Learning Exchange
Alex: Effects of Friction on a Moving Block
Students will move a 2 X 4 inch block with a hook attached across different surface areas. Students will discover how the friction created by these surface areas affect the movement of the block. Students will begin the activity by...
Microsoft
Microsoft Education Lesson Plan: Candy Is Dandy
Explore color distribution of M&M candies using this detailed lesson plan. An engaging integrated instructional activity that requires understanding of spreadsheets and formulas, and logical reasoning. Links to related websites.


![The Actuarial Foundation: Math Academy: Can You See It in Nature? [Pdf] Lesson Plan The Actuarial Foundation: Math Academy: Can You See It in Nature? [Pdf] Lesson Plan](https://static.lp.lexp.cloud/images/attachment_defaults/resource/large/FPO-knovation.png)
