Earth Watch Institute
Entering Local Groundhog Data in an Excel Spreadsheet
Here is a cross-curricular ecology and technology lesson; your learners create spreadsheets depicting the location and number of groundhog dens in a local park. They research groundhogs and analyze data about where the groundhog...
Curated OER
Basic Excel
Students explore basic Excel spreadsheets. For this spreadsheet lesson plan, students enter Alaska weather information and perform calculations. Students title the columns on the spreadsheet and format the cells. ...
Curated OER
Excel
For this technology worksheet, students are taught how to create documents using Excel. They follow the directions on a handout to help them create documents. They print their final work and submit it.
Curated OER
How to Graph in Excel
Fourth graders construct data graphs on the Microsoft Excel program. In this statistics lesson plan, 4th graders formulate questions and collect data. Students represent their results by using Excel.
Curated OER
Tessellations in Excel
Students complete an Excel project on tessellations. In this technology and math lesson, students discuss tessellations and their occurrences in nature. Students use the Excel computer program to create tessellations.
Curated OER
Basic Algebra and Computers: Spreadsheets, Charts, and Simple Line Graphs
Students, while in the computer lab, assess how to use Microsoft Excel as a "graphing calculator." They view visual representations of line graphs in a Cartesian plane while incorporating basic skills for using Excel productively.
Curated OER
Calculating Profits from Selling Virtual Lemonade
Students set up and collect data for a virtual lemonade stand. In this entrepreneurship, economics, and technology lesson plan, students purchase ingredients, determine costs, and set up a virtual lemonade stand. Students consider...
Curated OER
Building Arrays Using Excel Spreadsheets
Students create arrays using Microsoft Excel. In this technology-based math lesson, students expand their knowledge of multiplication by creating arrays on the computer using a spreadsheet program such as Microsoft Excel.
Curated OER
Using Electronic Manipulatives in Multiplication
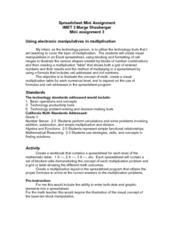
Factor polynomials using electronic manipulatives. Your class will create a spreadsheet in excel and use it to multiply and perform basic operations and solve problems correctly. They create a visual to go along with each multiplication...
Curated OER
Graphing on the Computer
Middle schoolers create a bar graph on the computer using given information from the teacher. They create a bar graph using their own information chart (they need to create one on separate paper first). They utilize Microsoft Excel for...
Alabama Learning Exchange
Origami Geometry
Origami is an excellent way to combine Japanese culture, art, and geometric shapes into one engaging instructional activity! Scholars begin by listening to the story Sadako and the Thousand Paper Cranes and learn the origin of...
Curated OER
Data! Data! Graph that Data!
Fifth graders create data graphs using Microsoft Excel. In this data collection lesson, 5th graders create and conduct a survey, then use Excel to organize and graph their data.
Curated OER
Journalism
Learners insert raw data about Ad sales into an Excel chart. They use raw data in a letter to local businesses by using the Mail Merge program. They represent data using tables and graphs.
Curated OER
Using Averages to Create Graphs Through Excel
Sixth graders create and use a spreadsheet to make graphs which will be used to analyze Progress Report and Final Report Card grades. They practice finding the mean, median, mode, and range of a data set. Students also incorporate column...
Curated OER
Interest Calculation and Spreadsheets
Students, while in the computer lab working on a spreadsheet program, calculate interest and accumulated value of a savings plan. They follow specific directives on how to create their spreadsheets. At the end of the lesson they print...
Curated OER
Using a Spreadsheet
Young scholars create a spreadsheet to analyze data. In this technology lesson, students develop and use an Excel spreadsheet to log their data. They solve real life word problems as they set it up using the spreadsheet.
Curated OER
Great Online Art Sites
Students complete an online study of art websites. In this art and technology lesson, students explore the links and try the activities to learn about art online.
Curated OER
Planet Protectors
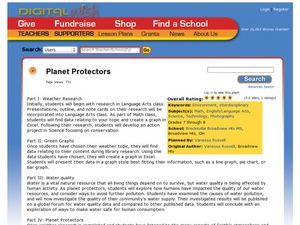
Students explore ways to protect the earth. In this environmental issues and technology lesson, students investigate the water quality in their community and compare their findings to the water quality in other geographic...
Curated OER
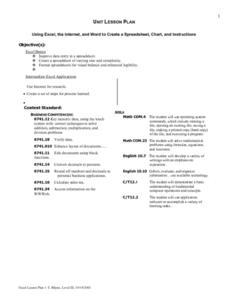
Using Excel, the Internet, And Word To Create a Spreadsheet, Chart, And Instructions
Students improve data entry in a spreadsheet.
Curated OER
Graph Frenzy!!
Learners brainstorm for a survey question to ask classmates. They survey their classmates. They enter the results into a spreadsheet and create the best graph for the information. They share their graphs with the class.
Curated OER
Visit My Class Wikis
Students visit the links on the blog site to learn about class wikis. In this technology integration lesson, students visit the links to view class wikis.
Curated OER
Holiday Cards using Publisher
Students create a holiday card using technology. In this technology lesson plan, students use Publisher templates to create a holiday card. Students organize, design, and edit their card.
Curated OER
Holiday Flier in Publisher
Students use Publisher in this lesson to make a holiday flier. In this technology lesson, students create a holiday flier. Students choose fonts, use clipart, use grammar and spelling check, and save to their work to a flash drive or...
Curated OER
Indegenous Cultures Magazine in Publisher
Fourth graders use Publisher to create their own magazine. In this online magazine lesson, 4th graders follow the instructions to create a magazine using text, pictures, and colors within the Publisher system.


