Curated OER
Energy Conservation (Middle, Mathematics)
Learners take turns reading the electric meter six times a day at regularly scheduled intervals. They figure out the amount of electricity used and then determine the total cost of electricity for the week.
Curated OER
Keeps on Pumping
Students measure and calculate heart rates per minute and for other units of time. They determine the amount of blood pumped by their heart during various intervals of time.
Curated OER
Fast Food Survey Using Bar Graphs
Second graders conduct survey and sort data according to categories, construct bar graph with intervals of 1, and write a few sentences about their graphs.
Curated OER
Balloon Graphing
Fourth graders explore data, charts and graphs. They create graphs using titles, labels, axes, intervals, and scale correctly. Students enter their data into Excel and create a graph.
Curated OER
In A Heartbeat
Learners discuss scatter plots then create a class scatter plot using their heart rate at rest and their heart rate after a few minutes of aerobic exercises. Students copy the points plotted as a class and create individual graphs...
Curated OER
A Picture's Worth a Thousand Words
Students analyze the numbers of male vs female administrators and teachers from their school. In this gender equality lesson plan, students use school yearbooks from the 1950's threw present to count how many male vs. female teachers,...
Curated OER
The Amazing Heart
Students examine human blood flow by comparing the pulse of athletes. In this human body lesson, students discover the equation for finding the cardiac output from a human heart. Students identify heart rates of accomplished...
Curated OER
Range and Mode
Fifth graders interpret data. In this mode and range lesson, 5th graders define mode and range and practice finding them given a set of data.
Curated OER
MVT for Derivatives
Young scholars find the derivative using the mean value theorem in this calculus lesson. They find the slopes of secant and tangent lines, then analyze the function and identify the slope.
Curated OER
Line Graphs
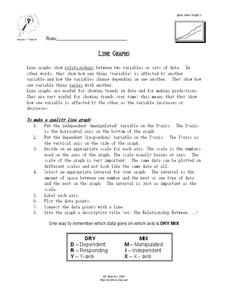
In this algebra worksheet, young scholars describe the relationship between a line graph and its data. They define the reasons line graphs are used and discuss increasing and decreasing lines. There is one involved questions, requiring...
Curated OER
Graphic Designing with Transformed Functions
Teach your class how to transform a graph! By identifying the domain and range of the functions, students can observe the parabola and find the vertex of the transformed graph.
Curated OER
Looking for More Clues
Fifth graders explore how to collect data and display it on a bar and circle graph.
Curated OER
The Second Fundamental Theorem of Calculus
Students investigate the fundamental theorem of calculus. For this calculus lesson, students derive the fundamental theorem of calculus. They differentiate between the first and second theorem.
Curated OER
Graph Logarithms
Mathematicians graph logarithmic equations. Teach your students how to identify the intercepts of logarithmic equations and tell whether the function is increasing or decreasing. They find the domain and range of each function.
Curated OER
Domain and Range 2
How do you identify the domain and range of the function? As learners find out it's as easy as creating a graph. They'll identify the domain and range of a relation from its graph, write symbolic expressions describing the relationship...
Curated OER
Exponential vs. Power
Pupils differentiate between exponential and power functions. They identify the base, exponent and properties of exponential functions. They also graph the functions using the TI calculator.
Curated OER
Fast Food Survey Using Bar Graphs
Second graders create a bar graph to pictorically represent the data collected from a survey of students. They use Excel to electronically create the graphs and data tallies. They then interpret their data using sentences to explain.
Curated OER
Technology: Koo Koo for Clocks
Third graders design and make clocks compiling a materials list, creating adesign portfolio, and recording progress in a daily log. After making a full-size drawing of their clocks and with the assistance of high school technology...
Curated OER
Probabilities for Number Cubes
Students explore the concept of probability. In this probability instructional activity, students roll a six-sided number cube and record the frequency of each outcome. Students graph their data using a frequency chart and...
Curated OER
What's Your Angle?
Third graders read the story, Magic Schoolbus Inside the Human Body. Then they form right, acute, and obtuse angles using the joints inside their bodies. They write a brief summary about what they learned about angles as a review the...
Curated OER
Introduction to Field Mapping with a Compass and Pace
Students practice using compass and calibrate their own pace, take field measurements of pre-set course with compass and pace, convert measurements into map, using angles and vectors, and make composite class map by adjusting different...
Curated OER
Graphs
Students explore graphs and define the different ways they are used to display data. In this algebra lesson plan, students collect data and plot their data using the correct graph. They draw conclusions from their graphs based on their...
Curated OER
Recording Frequency
First graders analyze nursery rhymes and gather data about word frequency. In this frequency lesson, 1st graders create graphs and tables. Students interpret the data.
Curated OER
Which Car Should I Buy?
Students use gas mileage of different cars to create T charts, algebraic equations, and graphs to show which gets better mileage. In this gas mileage lesson plan, students use the graph to see which car they should buy.


