Texas Instruments
Is It or Isn't It Proportional
How can you tell if number relationships are proportional? Mathematicians investigate proportional relationships. They compare and contrast functions and graphs to determine the characteristics of proportional relationships, as well as...
Curated OER
Discovering Pi
Define terminology related to a circle. Practice accuracy in measuring and then create a spreadsheet based on data collected from solving for parts of a circle. Groups can have fun analyzing their data as it relates to Pi.
Curated OER
Level III: Technology Integration
Fourth graders prepare two spreadsheets each with an embedded line graph that displays data about the growth of the bitter rot fungus on apples and on petri dishes that were stored in the refrigerator and the classroom. They prepare a...
Curated OER
What Makes Our Community Special?
Explore websites, complete research, and use technological tools to create a final multimedia presentation on what makes a community special. Learners of all ages work with a partner to research an interesting aspect of their community,...
Curated OER
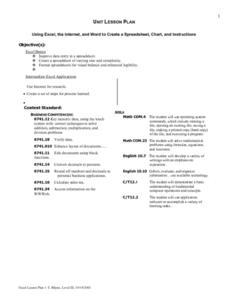
Using Excel, the Internet, And Word To Create a Spreadsheet, Chart, And Instructions
Learners improve data entry in a spreadsheet.
Curated OER
Dino-Myte Spreadsheet
Do your learners like dinosaurs and theme parks? An ambitious instructional activity invites learners to put together a plan for supplying dinosaurs for a new theme park. Pupils work together in groups to come up with their plan, which...
Curated OER
Iditarod
In this Iditarod worksheet, students complete word problems about fractions, money, and more, based on the Iditarod race. Students complete 10 problems.
Curated OER
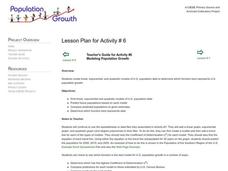
Modeling Population Growth
Students create linear, exponential, and quadratic models of U.S. population data to determine which function best represents U.S. population growth. They predict future populations based on each model.
Curated OER
Excel Lesson
Students investigate Microsoft excel. In this technology lesson, students create formulas using excel and apply these formulas to solve relative, absolute and mixed reference cells. They perform immediate and delayed calculations.
Curated OER
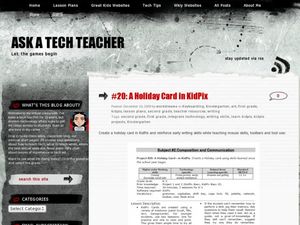
A Holiday Card in KidPix
Students create a holiday card using computer software. For this computer card making lesson, students design an original holiday card using a variety of tools. Students navigate the software utilizing various tools.
Curated OER
EXCEL It!
Students surf the Web gathering information about graphs. The data collected is incorporated into an Excel spreadsheet and graphs of varying nature generated to further enhance student understanding.
Curated OER
Lobster Roll!
Students collect data by playing a game that illustrates the delicate ecological balance between fishing, fishing regulations and fish populations. They graph and analyze the data and explain how economic decisions can affect the...
Curated OER
Mean, Median, Mode and Range
Fourth graders investigate when to find the mean, median, mode and range. In this statistical concepts lesson, 4th graders collect data, make observations and graph the data. Students verify their work on the computer.
Curated OER
One, Two, Three...and They're Off
Students make origami frogs to race. After the race they measure the distance raced, collect the data, enter it into a chart. They then find the mean, median, and mode of the data. Next, students enter this data into Excel at which time...
Curated OER
Giving'Em The Business
Learners work in groups of 4-5 to form a business, create, market & sell their product, and track their expenses and profits. They experience the roles of producer, distributor, and consumer of goods. They collect, organize and...
Curated OER
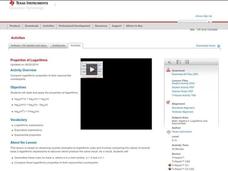
Properties of Logarithms
Learners investigate properties of logarithmic function as they add, subtract and multiply logarithms. They graph and analyze the graph for exponential equivalency.
Curated OER
Pumped Up Gas Prices
Students calculate gas prices. In this transportation lesson, students tally the mileage and gas costs of their car for one months. They figure out how much was spent on gas and create a graph showing average gas prices over time.
Curated OER
It's Your Life
Students make a multiple line graph showing income levels for each education level for the past 8 years and the number of people for each ethnic group and gender is compared within each education level.
Curated OER
Fire Safety Survey
Students collect data regarding fire safety and create a graph. Working in small groups, they administer a survey to family and friends regarding their attitudes toward fire safety. After data has been gathered, students graph their...
Curated OER
Visiting the Medical Fields
High schoolers act as medical pioneers to establish a clinic in an under served area.t They work in teams of two to complete a portfolio about their clinic and examine new treatments in various area of medicine.
Curated OER
How Quickly Disease Spreads
Students demonstrate how quickly disease spreads and the importance of protective measures with communicable diseases. They examine past epidemics such as the Bubonic Plague and make predictions about future epidemics.They compare and...
Curated OER
Let's Keep Track of Grades
Students participate in a technology project. This lesson is a hands-on spreadsheet project where students are responsible for keeping track of their grades for class. The students learn to enter data into a spreadsheet, create...


