Curated OER
Sets an the Venn Diagram
Students explore the characteristics of sets and Venn Diagrams. Given data, students practice determining the placement of elements in a Venn Diagram. Students discuss the correspondence between data sets and their graphical...
Curated OER
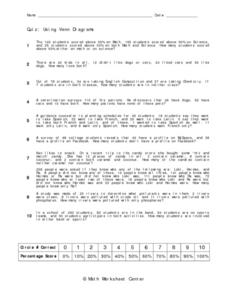
Using Venn Diagrams
In this Venn Diagrams worksheet, students complete and draw 10 different Venn Diagrams to match each problem as described. First, they determine the number of students who scored above half on math or science. Then, students compare the...
Curated OER
Venn Diagram- Two Circles
In this algebra worksheet, students use Venn Diagrams to compare and contrast their data given special equations. There are 4 questions with an answer key.
Curated OER
Shade the Venn Diagram
In this algebra worksheet, 11th graders identify what two sets of solutions have in common. They shade the given Venn diagram if the problems share common answers. There are 4 problems with an answer key.
Public Schools of North Carolina
Math Stars: A Problem-Solving Newsletter Grade 1
Keep the skills of your young mathematicians up-to-date with this series of newsletter worksheets. Offering a wide array of basic arithmetic, geometry, and problem solving exercises, this resource is a great way to develop the...
Curated OER
Venn Diagram-Two Circles
In this Venn Diagram worksheet, students analyze the union, intersection, and subtraction of three sets of Venn Diagrams.
Curated OER
Venn Diagrams
In this Venn diagrams worksheet, students look at different diagrams of sets A and B and complete problems about them. Students complete 4 problems.
Balanced Assessment
The Triskaidecaphobia Conference
Triskaidecaphobia is an extreme superstition to the number 13—and ironically the answer to the word problem is 13! Presented with a series of descriptive data, individuals analyze the data to determine the population size. They...
Curated OER
Graphing and Analyzing Biome Data
Students explore biome data. In this world geography and weather data analysis lesson, students record data about weather conditions in North Carolina, Las Vegas, and Brazil. Students convert Fahrenheit degrees to Celsius degrees and use...
Curated OER
Using Diagrams in Problem Solutions
Students use tables, graphs and diagrams to collect data. In this problem solving with diagrams lesson plan, students construct their own tables and graphs containing information they gather from a drawing. They also make a Venn Diagram...
Curated OER
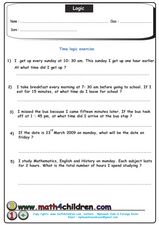
Logic
In this logic worksheet, learners read logic puzzles. They use tables and Venn diagrams to organize data and determine the answer to the question. This ten-page worksheet contains 16 problems. Answers are provided on the last half of the...
CK-12 Foundation
Mutually Inclusive Events: Card Game
Find probabilities of pulling cards. Using a Venn diagram, individuals sort five cards along the rules of a game. The pupils calculate compound probabilities using the information from the diagram. Initially, the interactive provides the...
Curated OER
Triple Venn Diagram
In this graphic organizer page, student complete a triple Venn Diagram. There are no specific questions or directions given with this page.
Curated OER
Venn Diagram and UK Basketball
Students analyze data and make inferences. In this algebra lesson plan, students collect and analyze data as they apply it to the real world.
Curated OER
Review - Chapters 1 & 2 Math 210: Sets
In this sets worksheet, students solve problems involving a Venn Diagram, the union of sets and subsets. They compute probability equations and solve counting problems. This one-page worksheet contains approximately 25 problems.
CK-12 Foundation
Sets: Bikes or Boards?
Do people ride, slide, or do both? Pupils use an interactive Venn diagram for the numbers of people owning bicycles, owning skateboards, or both. An interactive provides questions for them to answer using the diagram.
Curated OER
Venn Diagram
Students use a Venn diagram to show students' likes and dislikes of eggs and ham.
Curated OER
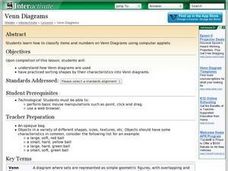
Venn Diagram Lesson Plan
Students use Venn diagrams in order to classify different objects and numbers. They then use "Venn Diagram Shape sorter" applets on the computer.
Curated OER
Union and Intersection of Sets
In this Algebra I/Algebra II worksheet, students determine the intersection and union of sets and solve problems with Venn diagrams. The three page worksheet contains a combination of seventeen multiple choice and free response...
Curated OER
The Rational Number System
In this rational number system worksheet, students identify rational and irrational numbers. They use a Venn Diagram to place numbers in their correct number set. This five-page worksheet contains approximately 10 problems. Answers are...
Curated OER
Gingerbread Baby v. Gingerbread Boy #7
Students read two stories. In this comparison lesson plan, students read "The Gingerbread Baby," by Jan Brett and the original "Gingerbread Boy." Students use a Venn Diagram to compare and contrast the two stories.
Curated OER
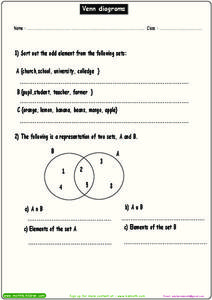
Venn Diagrams
In this Venn diagrams worksheet, students read the various elements and items in each group. Students sort out the odd elements in the groups using Venn diagrams.
Curated OER
Making Predictions
Students collect and classify items. In this making predictions lesson, students go outside and collect specimens of plants, insects and minerals. They classify each item and place them in a Venn Diagram. Students compare and contrast...
Curated OER
Straight and Curved Shapes Venn Diagram
In this math activity, students classify the shapes according to the correct category concerning having straight or curved sides.
Other popular searches
- Venn Diagrams Math
- Venn Diagrams in Math
- Graphing Math Venn Diagrams
- Sorting Math Venn Diagrams
- Venn Diagrams & Math
- Math Venn Diagrams Shape
- Venn Diagrams Math Fractions
- Sets Venn Diagrams Math
- Venn Diagrams for Math
- Math Venn Diagrams Worksheet
- Math Venn Diagrams Graphs
- Sets and Venn Diagrams Math

