Curated OER
Piggie Pie!
Students explain about their experiences on the farm and draw pictures to show what they know. Students read the recipe for the piggie pie that Gritch was going to use. Students estimate and then measure how many pigs it would take to...
Curated OER
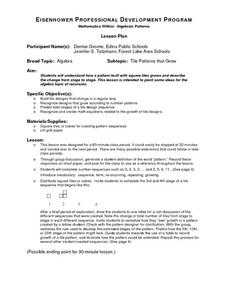
Tile Patterns that Grow
Students explore how a pattern built with square tiles grows and describe the change from stage to stage. They predict later stages of a tile design sequence and create math equations related to the growth of tile designs.
Curated OER
Butterflies and Flowers
Students observe and demonstrate the concepts of over, under, and on. Using a cutout of a flower and a butterfly, they identify if the butterfly is over, under, or on the flower. Students complete a worksheet along with the teacher, and...
Curated OER
Building Arrays Using Excel Spreadsheets
Students create arrays using Microsoft Excel. In this technology-based math instructional activity, students expand their knowledge of multiplication by creating arrays on the computer using a spreadsheet program such as Microsoft Excel.
Curated OER
Introduction to Inverse Functions
Learners investigate patterns of inverse functions. In this algebra lesson, students represent functions with the calculator and on paper. They analyze their data and draw conclusions.
Curated OER
Fixed Perimeter Rectangle
Teach how to solve for the area and perimeter of rectangles. For this geometry lesson, students are given fixed perimeter rectangles and asked to find the area and side length of the rectangles. they draw their rectangle on the navigator...
Curated OER
The Circle's Measure
Students explore circumference and diameter. In this math lesson plan, students apply their knowledge of circumference and diameter to solve mathematical riddles. Students apply this knowledge to find circumference and diameter of...
Curated OER
Assessing Normalcy
Students define normal distribution as it relates to the bell curve. In this statistics lesson plan, students use the central tendencies of mean, median and mode to solve problems. They plot their data and draw conclusion from the graphs.
Curated OER
Sampling Distributions
Pupils analyze sampling from different population. For this statistics lesson, students define the meaning of sample sizes and what causes an increase or decrease. They graph their data on the Ti calculator and draw conclusion from the...
Curated OER
Why Divide by N-1?
Students identify the mean and variance. In this statistics activity, students calculate the population variance using the N as a divisor. They draw the relationship of dividing by N and N-1.
Curated OER
ABC's Transformer
Fourth graders design their own letter graph, and then produce the resulting graphs after a translation, reflection, and rotation. After a review of vocabulary, 4th graders create their graphs using crayons.
Curated OER
2-D Geometry
Third graders describe and compare attributes of two-dimensional shapes. They explain geometric terms, angles and shapes. Students demonstrate each vocabulary word with their body and they mirror the body positions associated with each...
Curated OER
Forming, Measuring and Labeling Angles
Pupils draw and measure angles. In this angle measurement lesson, the teacher demonstrates how to form and measure angles while explaining the parts of an angle, then students practice.
Curated OER
Time & Itineraries Two
Students explore time management by participating in clock reading activities. In this itinerary lesson plan, students define a list of time telling vocabulary terms and practice reading analog clocks with a partner. Students identify...
Curated OER
Conserving Resources by Watering Efficiently
Learners determine a watering schedule that promotes healthy grass growth. For this plants and natural resource conservation lesson, students plant grass seed in liter bottles and follow two different schedules that include "more...
Curated OER
Graphing Scatterplots
Students examine scatterplots and determine the equation of a line using the slope-intercept method. Students interpret graphs, draw inferences, and sketch a curve of best fit for the graph. Based upon patterns in the graphs, students...
Pennsylvania Department of Education
Adding and Subtracting Three-Digit Numbers by Jumping
Second graders use data to graph information and draw conclusions. In this instructional activity on data analysis, 2nd graders practice gathering, sorting, comparing, and graphing data. Students differentiate data that can and cannot...
Curated OER
Comparison of Two Different Gender Sports Teams - Part 1 of 3 Measures of Central Tendency
Young scholars gather and analyze data from sports teams. In this measures of central tendency lesson, students gather information from websites about sports team performance. Young scholars analyze and draw conclusions from this data....
Curated OER
Measuring Perimeter
Have your class practice measuring the perimeter of various objects using this resource. Fifth graders place various-sized polygons in order (from largest to smallest). They use non-standard measuring tools to estimate the distance...
Virginia Department of Education
Relationships Round Robin
Mathematics is all about patterns. Young mathematicians analyze geometric patterns to write algebraic expressions. They use the expressions to predict future stages of the patterns.
Virginia Department of Education
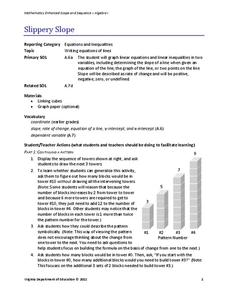
Slippery Slope
Explore slope using geometric patterns. Young mathematicians investigate towers built from cubes to develop a linear pattern. They move the data to a coordinate plane to connect the pattern to slopes.
Curated OER
Operations on Polynomials
Learners simplify and reduce polynomials. In this algebra lesson, students find the sum, difference, product and quotient of polynomials and monomials. They use the order of operation correctly.
Curated OER
Symbols in Algebra
Students name and sketch numerical expressions. In this order of operation lesson, students add, subtract, multiply and divide using the correct order of operation. They perform four specific calculations for their motivation lesson.
Virginia Department of Education
Rational Speed Matching
Ready, set, go! Individuals practice converting rational numbers between fractions, decimals, and percents. A speed game has teams match the three forms of rational numbers on a number line.

