Curated OER
Graph Frenzy!!
Students brainstorm for a survey question to ask classmates. They survey their classmates. They enter the results into a spreadsheet and create the best graph for the information. They share their graphs with the class.
Curated OER
Cylinder: Teacher Notes
Middle schoolers construct a basic cylinder out of a piece of paper, then answer seven questions about their cylinder. Questions have to do with measurement, volume, radius, etc.
Curated OER
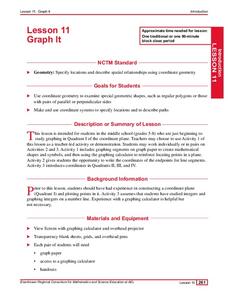
Graph It
Elementary and middle schoolers engage in a lesson of graphing in quadrant I of the coordinate plain. They use the graph to create shapes and symbols. While using a graphing calculator, they locate the points on the coordinate plane. In...
Curated OER
Eraser Dog: Percents
In this percents worksheet, students solve 30 different problems related to determining percents of numbers. First, they define a percent as a ratio whose second term is 100.
Curated OER
Decimals and Fractions
Young scholars convert fractions to decimals. They are shown how to convert fractions to decimals through teacher demonstration on the board. A 20-problem worksheet and answer key are included.
Curated OER
Students Favorites
Students complete activities using a frequency table and construct a pie graph for the data. For this frequency table lesson, students complete a survey to find data for a frequency table. Students use the given link to make a pie graph...
Curated OER
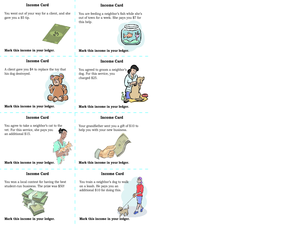
Income and Expenses
Students discuss income and expenses. In this lesson on money, students define income and expenses, after whith they keep track of their income and expense transactions on a basic ledger.
Curated OER
Graphing and Interpreting Linear Equations in Two Variables
Graph linear equations using a table of values. Learners solve equations in two variables using standard form of an equation. They identify the relationship between x and y values.
Curated OER
Plugging Into The Best Price
Examine data and graph solutions on a coordinate plane with this algebra instructional activity. Young problem-solvers identify the effect of the slope on the steepness of the line. They use the TI to graph and analyze linear equations.
Visa
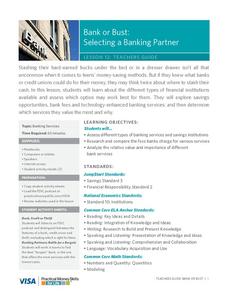
Bank or Bust: Selecting a Banking Partner
Why shouldn't we just save all our money in our mattress? Couldn't our money disappear? Pupils discover the benefits of utilizing banks and credit unions for saving money, as well as how to evaluate different types of...
Institute of Electrical and Electronics Engineers
Exploring at the Nanoscale
Nano-nano! Nanotechnology can seem like it's from another planet! After learning about this tiny technology, collaborative groups experiment with how smaller particles affect chemical reactions. They do this by immersing a whole and a...
Curated OER
How High?
Fourth graders play an estimation game to guess how sheets of paper are in a pile and then guess who high a stack of one million would be. They work in small groups to explore ideas for working out how high the stack would be.
Curated OER
Not Just an Average Class
Fourth graders work together to find the median, mode, and mean of their first and last names using a numerical code in this fun, interactive lesson plan. After a lecture/demo, 4th graders utilize a worksheet imbedded in this plan to...
Curated OER
Toothpick Bridges
Students study the techniques of building a bridge. They explore different type of bridges and then plan and build a bridge to specified instructions. Students draw plans, keep a budget, and prepare balance sheets during their bridge...
Curated OER
Grade 2: Texas Problem Solving
Second graders use numerical data about Texas to write and solve real-life problems involving addition and subtraction (or multiplication and division). They work in pairs to choose three numerical facts about Texas to use to make up...
Curated OER
PASS the Arts
Learners explore math and art concepts, create digital art examples of the concepts, and incorporate these works into a PowerPoint portfolio with explanation and analysis.
Curated OER
Coin Conversions
Fifth graders engage in the study of conversions from decimals to percents while examining monetary values. They explain the relationships between the equivalency interchanging decimals with percents. Then students write about the...
Curated OER
Reservoir Activity
Students research the economic importance of the major reservoirs in Illinois. In groups, they manage a budget for one of the lakes to promote tourism in the area. They also work together to create advertisements.
Curated OER
A Picture is Worth a Thousand Words
Sixth graders work to write questions for a class survey. In this survey lesson, 6th graders survey their class members by asking the 4 questions they developed and will record their answers on the culminating assessment...
Curated OER
A4 Containers
Fifth graders determine which container made from a single sheet of paper has the greatest volume. They look the solutions made by three different students before working on their own examples.
Curated OER
Polygons
Students work together to create mobiles with different polygons. They research the polygon and list its characteristics. They may present to the class if they chose to.
Curated OER
Brainstorming and Number Patterns
Ninth graders discover what it means to "brainstorm." They explore a given simple number pattern and then, working in groups, brainstorm more complicated number patterns. They display them around the room and then solve the number...
Curated OER
Jog & Jump Partner Activity (with Digi-Walker Pedometers)
Student, work in pairs, to measure their jumping and jogging on a pedometer. They add the jumping and jogging scores together to get a team score.
Curated OER
Mathematics of Fair Games
Students study about mathematicians' notion of fairness in games of chance. They work in pairs to perform three different experiments using macaroni and paper bags. They record their results on charts and discuss the fairness of the games.


