Inside Mathematics
Marble Game
Pupils determine the theoretical probability of winning a game of marbles. Individuals compare the theoretical probability to experimental probability for the same game. They continue on to compare two different probability games.
Noyce Foundation
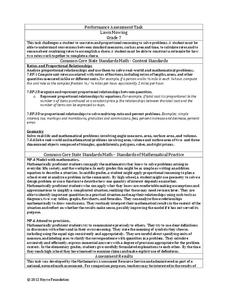
Lawn Mowing
This is how long we mow the lawn together. The assessment requires the class to work with combining ratios and proportional reasoning. Pupils determine the unit rate of mowers and calculate the time required to mow a lawn if they work...
Curated OER
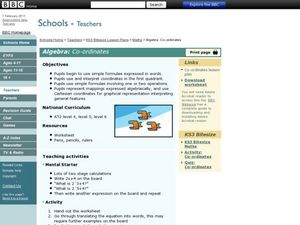
Algebra: Co-ordinates
Students use Cartesian coordinates. In this graphing lesson students use simple formulae, interpret coordinates, and create graphical representations. They express their work algebraically.
Spectrum
Grade 5 Standardized Test Prep
Here you'll find a great sampling of practice standardized test questions organized into four sections: ELA, mathematics, social studies, and science. Help your learners become familiar with the types of multiple-choice questions...
Curated OER
Exploring the Slopes of Parallel and Perpendicular Lines
Students calculate the slope of parallel and perpendicular lines.In this algebra lesson plan, students differentiate between parallel and perpendicular lines. They graph their lines using the slope of the equation.
Virginia Department of Education
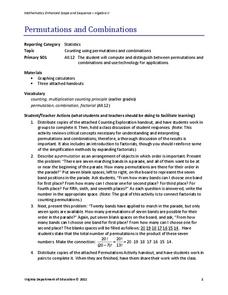
Permutations and Combinations
Counting is not all it adds up to be — sometimes it involves multiplying. The activity introduces permutations and combinations as ways of counting, depending upon whether order is important. Pupils learn about factorials and the...
Curated OER
What's Your Favorite Planet?
Fourth graders interpret a graph and make correlations using data. After taking a class survey, 4th graders create a class graph of their favorite planets. Working in small groups, they interpret the information and create at least ten...
Curated OER
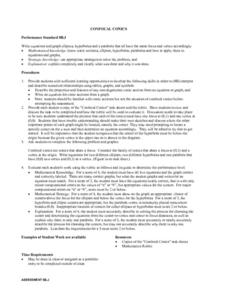
Confocal Conics
Students describe conic sections from an equation or graph. They examine a family of conics that share a vertex, describe their relationship and write an equation. Students interpret the relationship between conic sections and write...
Curated OER
Viewing Tubes
Students complete a lab in order to discover if the length of a viewing tube, its diameter, or the distance from an object affect the type of data collected and the resulting graph.
Curated OER
Atlatl Lessons Grades 4-12: Lesson for Beginning Users of Atlatl
Sixth graders determine the mean, range median and mode of a set of numbers and display them. In this data instructional activity students form a set of data and use computer spreadsheet to display the information. They extend of...
Pennsylvania Department of Education
Multiplication Represented as Arrays
Third graders collect data about themselves and use in a line plot. In this analyzing data lesson, 3rd graders collect various sets of information,create a line plot and compare the data. Students complete a worksheet on their...
Curated OER
One, Two, Three...and They're Off
Students make origami frogs to race. After the race they measure the distance raced, collect the data, enter it into a chart. They then find the mean, median, and mode of the data. Next, students enter this data into Excel at which time...
Curated OER
The Great Pollinators
Young scholars discover the reproductive parts of a plant. In this biology lesson, students identify and categorize several different plants they dissect in class. Young scholars record their information using a data chart.
Curated OER
Baseball Statistics
Students take an in depth examine baseball record breakers. They calculate statistics, not just for one year, but over whole careers, to compare some famous players and find who was the best all-time home run hitter.
Curated OER
An Introduction to Functions
Students investigate the growth and decay of an exponential function. In this algebra lesson, students apply properties of exponent solve problems. They identify any patterns they see in the graphs.
Curated OER
The Treasure Map
Third graders problem solve using drawings and map interpretations. They preview graphs and Cartesian geometry. They follow directions on a map using a grid and compass references while simulating they are reading a pirate map.
Curated OER
Hopes and Dreams: A Spreadsheet Lesson Using Excel
Fourth graders read "The Far Away Drawer" by Harriet Diller and discuss the story as a class. After discussion, 4th graders create a t-shirt GLYPH about their hopes and dreams,share their information with the class and create spreadsheets.
Curated OER
Frequency Tables and Stem-and-Leaf Plots
Students are introduced to the function of frequency tables and stem and leaf plots. In groups, they determine the frequency of their teacher coughing, ringing a bell or raising their hand. To end the lesson, they determine frequency...
Curated OER
Heart Smart in a Heart Beat
As an introductory activity, young statisticians measure their heart rate at rest and after exercise and compute the mean and median, and create a box & whisker plot. This is followed by watching a video (that no longer seems...
Curated OER
Equivalent Fractions Manipulatives
Students study fractions. In this equivalent fractions instructional activity, students utilize fraction strips to enhance their understanding of equivalent fractions. They watch a demonstration and then work independently with their own...
Curated OER
Bar Me In
Fourth graders watch a video about constructing bar graphs. They create their own graph and interpret it.
Curated OER
Hurricanes in History:
High schoolers interpret data displayed in a graph, make inferences based on graphical data. They work in pairs or groups to interpret graphs containing historical data of hurricanes, and then answer questions that assess their...
Curated OER
The Workers
Students observe the axis of a graph on the board and add the title and axis labels. They plot two points on the graph and join the two with a line and work to describe the story in each of the graphs.
Curated OER
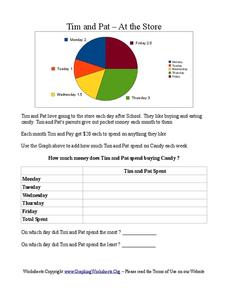
Tim and Pat - At the Store
In this pie chart activity, learners use the pie chart to add the amount of time Tim and Pat spend buying candy each day of the week. Students answer 2 questions about the table.

