Curated OER
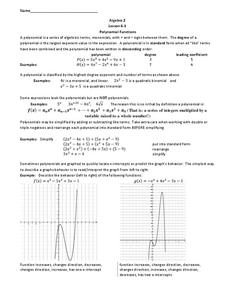
Polynomial Functions
In this Algebra II activity, 11th graders classify polynomials by degree, write in standard form, and describe the behavior of the graph. The two page activity provides explanation and examples along with thirteen practice problems....
Curated OER
A Relatively Far Out Idea: Estimating
Students investigate methods of estimating through cooperative group activities, hands-on activities, the use of tables and graphs and an interactive video.
Curated OER
Investigating the Probability
Students investigate probability using coins and dice. They collect data, graph, organize and interpret data. They predict, describe, compare, compute and draw conclusions based on what they observe and record.
Curated OER
Pumpkin Properties are a Smash!
Students receive a miniature pumpkin and proceed through several stations to measure a variety of physical properties. The data is entered into a data sheet and the mass and volume measurements are used to calculate density. They also...
Curated OER
The Survey Says
Learners experience the development of statistical data. In groups, they construct a survey questionnaire for a target audience. Students produce the questionnaire, distribute it, collect it, and tabulate the data. Using EXCEL, the...
Curated OER
Geometry Coordinates
In this geometry worksheet, 10th graders calculate ordered pairs using a table to plot the coordinate pairs to make a graph. There are 3 graphing question.
Curated OER
Count On It!
Learners practice counting money. In this consumer math lesson, students identify the various U.S. coins and group them in various ways to equal a dollar. Learners will use the money they collected for a donation towards a non-profit...
Curated OER
Confidence Levels
Students collect data and graph it. For this statistics lesson, students rate confidence levels by collecting data and analyzing it. They graph their findings on the Ti calculator.
Curated OER
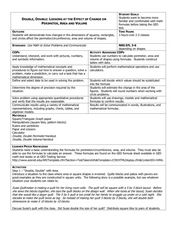
Double, Double: Looking at the Effect of Change on Perimeter, Area and Volume
Students explore perimeter, volume, and area. In this math instructional activity, students explore how changes in dimensions of geometric shapes affect the perimeter, area and volume of the various shapes. Students investigate the...
Curated OER
Putting Your Best Foot Forward
Third graders measure their feet and their parents' feet, record data on computer-generated graphs, and calculate and record mean, median, and mode.
Curated OER
Box And Whiskers
Learners investigate the concept of using box and whisker plots. They demonstrate how to use them to compute median, mode, and range. Students compare and contrast the complete and systematic processes use to solve problems. This is done...
Curated OER
Compass Designs
Young scholars investigate the properties of two and three dimensional objects. In this geometry instructional activity, students differentiate polygons based on similarity and congruence. They make observation and interpret the data.
Curated OER
Stem-and-Leaf Plots
Seventh graders study steam-and-leaf plots. Given specific data, they create a stem-and-leaf plot . Students identify the mean, mode, range and median. Afterward, they review vocabulary words.
Curated OER
I'm a Weather Watcher Watching plants grow by......my,my,my
Students investigate how weather affects how plants grow. They collect data on weather and plant growth for a week and display the data on a graph. For a culminating experience they design a movie using software that shows plant growth...
Curated OER
Data Collection and Presentation
Students concentrate on discrete quantiative data. They are shown that the vertical line diagram as a more appropriate way to present discrete quantiative data then bar charts. Students work as a group to help with the interpretation...
Curated OER
Picnic Possibilities
Fourth graders plan a picnic using weather data. Using accumulated weather data from various sources, they create a graph of the weather conditions in their region for a given period of time. Students interpret this data to predict the...


