Curated OER
Circular Motion
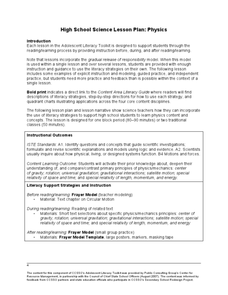
Twelfth graders discuss centrifugal force, frictional force, and critical speed as it relates to the popular amusement park ride, the Gravitron.
PBS
Surface Area and Volume
You and your class will like this lesson on using visual models to relate the volume and surface area of solid shapes. Learners construct three-dimensional forms using nets. They calculate the surface area and volume for each and then...
Curated OER
Conditional Probability and Probability of Simultaneous Events
Students explore the concept of conditional probability and probability of simultaneous events. In this conditional probability and probability of simultaneous events lesson, students roll dice or use and applet to roll dice to determine...
Curated OER
Maps and Modes, Finding a Mean Home on the Range
Fifth graders investigate data from maps to solve problems. In this data instructional activity, 5th graders study maps and collect data from each map. Students present their data in a variety of ways and calculate the mode, mean,...
Curated OER
Videobusters
A real-world scenario, Videobusters, a video rental store has just got to get organized. In small groups, the class works on organizing and analyzing data utilizing matrices. They need to use their skills in adding, subtracting and...
Curated OER
Developing the Concept: Percents
In this percents lesson, learners review how to solve a multiplication equation where they must solve for a variable. They solve equations with missing numbers and percents.
Shodor Education Foundation
Surface Area of Rectangular Prism
With this interactive lesson, learners compute the surface area of rectangular prisms. They visit an online investigation applet and record data on the provided handout. Pair this lesson with the volume lesson by the same publisher as an...
Shodor Education Foundation
Volume of Prisms
Explore the concept of volume of prisms using an applet to perform the calculations. The link to the interactive applet is embedded into the lesson plan as well as a link to associated data sheets. Get your math class to the computer lab...
Curated OER
Volume of Rectangular Prisms
Introduce the procedure needed to find the volume of a rectangular prism. Learners rank various prisms such as cereal boxes and tissue boxes from smallest to largest volume. They use an applet to find the volume and surface area of each...
Curated OER
Leaf Weight-Loss Plan
Pupils measure the weight of a container of leaves daily to discover how quickly it grows lighter as the foliage dries.
Curated OER
So, the Test Is Positive
Students participate in a probability-based exercise. They consider the implications of testing positive for a cancer when the test is less than 100% accurate and analyze their results.
Curated OER
Pacing a Gunther Chain
Students pace a Gunther Chain, a measurement used by foresters to determine distance and area. They discuss that pacing is individualized depending on age, gender, etc. They practice to find an average pace. Teams estimate, pace and...
Curated OER
Introduction to Limits
High schoolers practice using graphing calculators and spreadsheets as they explore numeric limits using sequences and functions. They complete a sequencing worksheet, and determine which sequence corresponds to story a story called...
Curated OER
Which Chocolate Is The Biggest?
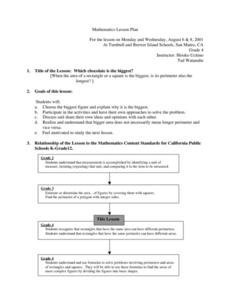
Students investigate the concepts of area and perimeter with the use of chocolate bars. They calculate the perimeter and area of different size rectangle chocolate bars and record the statistics. Then students make a visual comparison...
Curated OER
Multiplication Tables Using Microsoft Excel
Eighth graders are introduced to Microsoft Excel as a computer application software program. They create multiplication tables in Microsoft Excel. Students work in small groups. They discuss the $ (anchor) function in Microsoft Excel.
Curated OER
Finding Circumference and Area of a Circle
Young geometers explore the concept of circumference and area of circles. They discuss what information is needed to find circumference and area. The resource employs several instructional methods: Frayer Model for Vocabulary, literature...
Curated OER
MP3 Purchase Plans
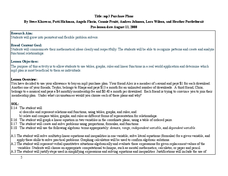
Use algebra to solve real world problems. Mathematicians practice use of graphs, tables, and linear functions to solve a problem regarding mp3 purchase plans. They work in groups to solve the problem and present their findings and...
Curated OER
Father's Day Wind Chimes
Students create wind chimes for Father's Day. In this art lesson, students construct a wind chime for their father using plastic tubs, metal washers and fishing line.
Illustrative Mathematics
Same Base and Height, Variation 1
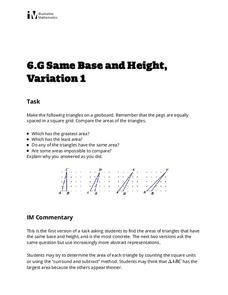
Four triangles are depicted for learners to construct on a geoboard. They compute and compare the areas, and so meet one of the sixth grade Common Core standards for geometry. Note that the set of triangles does not include a right...
Curated OER
Cross Country Adventure
Students practice measurement and geography in this lesson. They build a Lego vehicle using an RCX. They predict how many seconds it will take their vehicle to reach a specific state on the United States of America map that each group of...
Curated OER
Area Applet
Elementary math classes calculate the area of a shape and explain the correlation between the size of the perimeter and the areas that can be contained within that perimeter. They also explain the effect the shape of the perimeter has on...
Illinois State Board of Education
Solar System
Aspiring astronomers solve problems involving mixed units of the same attribute, including time, money, length, and area. They convert large numbers into scientific notation, then compute and compare ratios to explain why drawing...
Curated OER
Investigation-Looking at Polygons
Eighth graders plot points and investigate polygons. They locate a point, using ordered pairs of integers on the coordinate plane. Students compare geometric measurements and computations on coordinate axes as they are applied to...
Curated OER
Investigation-How Many Toothpicks?
Seventh graders use toothpicks to investigate a series of designs and identify patterns. Data is organized and analyzed using tables and graphs, and students make generalizations using algebraic expressions.
