Curated OER
Data Handling
In this data handling worksheet, students determine biased and unbiased questions to surveys. They explore methods of data collection and design a data collection sheet. This two-page worksheet contains 3 multi-step problems.
Curated OER
Data Handling
In this data handling worksheet, students interpret data found in table, graphs and charts. They organize data and draw bar charts. This two-page worksheet contains 2 multi-step problems.
Curated OER
Data Handling
In this data handling worksheet, 6th graders solve and complete 4 various types of problems. First, they draw a bar chart to represent the information provided in the table shown. Then, students show beneath the table how to work out the...
Statistics Education Web
Types of Average Sampling: "Household Words" to Dwell On
Show your classes how different means can represent the same data. Individuals collect household size data and calculate the mean. Pupils learn how handling of the data influences the value of the mean.
Curated OER
Data Handling: Bar Chart Showing Frequency
In this bar graph worksheet, students analyze a bar graph showing soccer goals scored. Students then use the data to solve 7 problems.
Curated OER
Data Handling: Bus Charts
In this data display and analysis worksheet, students study a bar graph that shows the number of people who ride the bus at different times of day. Students use the graph to solve 6 problems. Note: Bus times are shown in 24 hour clock time.
Curated OER
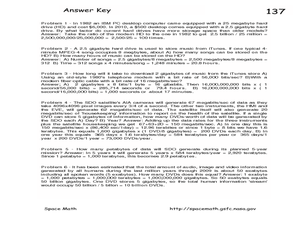
Scientific Data-The Gift That Keeps on Giving!
In this scientific data worksheet, students solve 6 problems related to the data to be collected by the Solar Dynamics Observatory Mission. The problems include finding the number of bytes necessary in discs and drives to store a given...
Curated OER
Data Handling
In this data handling learning exercise, students explore multiple ways to represent data. They create stem and leaf plots, histograms, and bar charts. Students examine and interpret diagrams and statistics. This...
Curated OER
Data Handling: Sorting Shapes
In this recording data and shape sorting instructional activity, students color a chart to show how many green cubes and yellow cylinders are shown. They color the correct number of each shape.
Curated OER
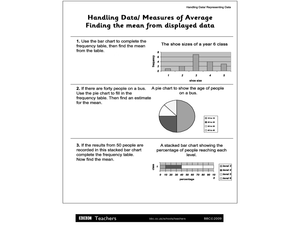
Handling Data/Measures of Average - Finding the Mean from Displayed Data
In this mean and average worksheet, students use the bars and charts to help them find the means using the given data. Students solve 3 problems.
Curated OER
Data Handling: Tally Chart on Illnesses
In this tally chart worksheet, students analyze a chart showing childhood illness cases. Students use the tally chart to solve 6 problems.
Curated OER
Data Handling: Pictogram of Birds
In this pictograph problem solving worksheet, students analyze a pictograph of birds seen each day for a week. They use the information on the graph to solve 6 problems.
Curated OER
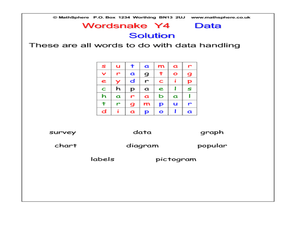
Word Snake: Data
In this data worksheet, students search for words in a word snake, which works like a maze, for words that represent data. Students search for 8 words.
Curated OER
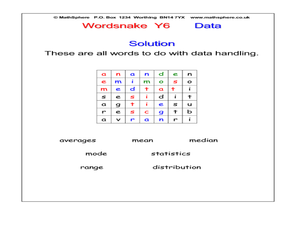
Wordsnake: Data
In this data words worksheet, students search for data words in a wordsnake which looks like a word search. Students look for 7 words.
Bowland
Public Transport
"Statistics is the grammar of science" -Karl Pearson. In the assessment task, learners read a claim made by a newspaper and analyze its conclusions. They need to think about the sample and the wording of the given statistics.
Curated OER
Maps and Lines
In these organizing data worksheets, 5th graders complete four worksheets of activities that help them learn maps, graphs, and lines. Students then study images of maps, lines, and graphs.
Curated OER
Tally Chart: Favorite Names
In this data display learning exercise, students analyze a tally chart of favorite hamster names. Using the information on the chart, students solve 8 word problems.
Curated OER
Handling Data- Health Statistics
In this social studies activity, students organize 50 country cards into groups. Students analyze a chart and group countries according to lowest, middle, and highest Infant Mortality Rate.
Curated OER
Solar Dynamics Observatory: Working with Giga, Tera, Peta and Exabytes
In this solar observatory learning exercise, students read about the solar observation data that NASA will be collecting. Students solve 6 problems related to the collection of data using computers to store the solar data using...
Curated OER
My Test Book: Reading Graphs
In this online interactive math skills worksheet, students solve 10 multiple choice math problems that require them to read and interpret graphs. Students may view the correct answers.
Curated OER
My Test Book: Stem and Leaf Plots
In this math skills learning exercise, students solve 10 multiple choice math problems which require they interpret a stem and leaf plot. Students may view the correct answers.
Curated OER
E3 Practice Assessment - Pets
In this assessment worksheet, 3rd graders complete eight pages of math assessment. Students solve problems related to money and a bar graph. Students solve word problems involving rounding and computation.
Beyond Benign
Green"er" Precipitation Reaction
All sodium carbonate may not have the same amount of carbonate, but it should have the same percent. Learners write and balance an equation to predict the chemical reaction between sodium carbonate and zinc acetate. Through the lab...
Curated OER
Smarties Investigation
In this math worksheet, learners participate in an investigation of Smarties candy. For example, students estimate how many candies they have in each color, count the actual number, and record the information in a tally chart.


