Hi, what do you want to do?
Illustrative Mathematics
Illustrative Mathematics: 6.sp4, 5c Puzzle Times
A performance task asking students to create a graph of provided information and then find the mean and the median of the data.
Other
Magoosh: Statistics Fundamentals
An online course on the fundamentals of statistics including video lessons in Mean, Median, and Mode; Weighted Averages; Quartiles and Boxplots; Range and Standard Deviation; Normal Distribution; Z-scores; Intro to Inferential...
Texas Instruments
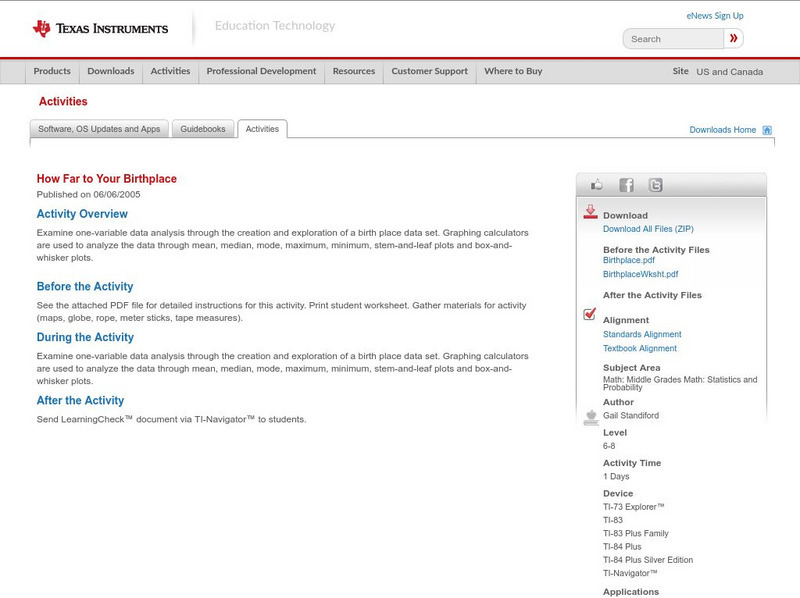
Texas Instruments: How Far to Your Birthplace
Examine one-variable data analysis through the creation and exploration of a birth place data set. Graphing calculators are used to analyze the data through mean, median, mode, maximum, minimum, stem-and-leaf plots and box-and-whisker...
CK-12 Foundation
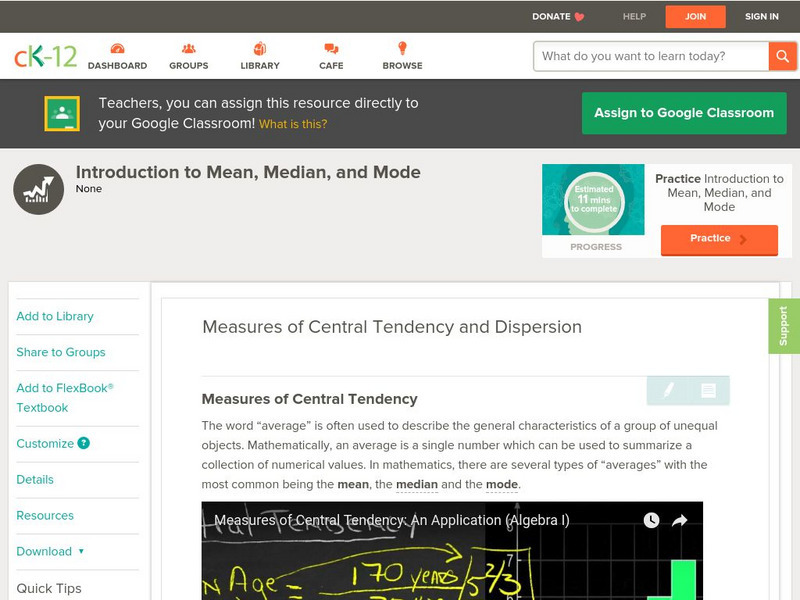
Ck 12: Measures of Central Tendency and Dispersion Grades 9 10
[Free Registration/Login may be required to access all resource tools.] Decide which measure of central tendency best describes a data set.
ClassFlow
Class Flow: Analyzing Data Mean, Median and Mode
[Free Registration/Login Required] Explores ways of analyzing data in a table.
Soft Schools
Soft Schools: Probability and Statistics Quiz
Students are asked to find the mean, median, mode, and range of a data set. Also, they must be able to interpret graphs and tables, and graphically represent data. The quiz is multiple choice and consists of nine questions, and a summary...
Ducksters
Ducksters: Kids Math: Probability and Statistics Glossary and Terms
Math glossary and terms on probability and statistics for kids. Learn the definitions used in this mathematics subject such as mean, median, and mode on this site.
ClassFlow
Class Flow: Mean, Median, Mode
[Free Registration/Login Required] Use this flipchart to help teach your students about Mean, Median, and Mode. Be ready to pull out the random number generator. Your students will be fully engaged as the dice are rolling.
Cuemath
Cuemath: Measures of Central Tendency
A comprehensive guide for learning all about measures of central tendency with definitions of mean, median, and mode, solved examples, and practice questions.
Google
Google for Education: Sorting Data
In this example students use data collected from their class and learn to sort it before calculating the mean, median, and mode. Additionally, students learn how to use spreadsheet functions to sort based on different criteria, leading...
Shodor Education Foundation
Shodor Interactivate: Lesson: Stem and Leaf Plots
Lesson plan introduces students to stem-and-leaf plots. Many resources are available for student and teachers here.
That Quiz
That Quiz: Practice Test: Graphs
This resource allows users to test their knowledge of graphs and graphing methods.
E-learning for Kids
E Learning for Kids: Math: Music Center: Mixed Problem Solving
Help Dracco the drummer with solving different fun math problems.
Sophia Learning
Sophia: Finding Mean, Median, and Mode: Lesson 5
This lesson will demonstrate how to find the mean, median, and mode for a set of data. It is 5 of 5 in the series titled "Finding Mean, Median, and Mode."
Other
American Youth Policy Forum: Thinking About Tests and Testing [Pdf]
A comprehensive primer in assessment literacy that seeks to raise awareness of key aspects about tests and testing issues. Explains essential statistical terms associated with testing (mean, modes, medians, distribution, dispersion,...
Better Lesson
Better Lesson: Analyze This! Mean Median Mode and Range
Finding measures of central tendency will be applied to the different graphs throughout this unit.
Other
Csulb: Stem: How Much Water Fits on a Penny? [Pdf]
Students explore mean, median, mode, and range with this hands on activity.
Better Lesson
Better Lesson: Understanding Data!
Fourth graders will gear up to explore how to find the means, median, and modes to represent data.
Shodor Education Foundation
Shodor Interactivate: Skew Distribution
Change the median and standard deviation of an automatically generated normal distribution to create a skewed distribution, allowing you to observe properties like what it means for the mean, median, and mode to be different.
Concord Consortium
Seeing Math: Plop It
Plop It! lets you experiment with the concepts of mean, median, and mode (measures of center). You see the differences among them on a bar graph, as you add or remove blocks to an axis with a given range.
Better Lesson
Better Lesson: Analyze This Part 2!
Srudents connect mean, median, mode and range to real life. It will allow students to make sense of problems by using previously taught strategies.
Shodor Education Foundation
Shodor Interactivate: Plop It!
PlopIt allows users to build dot plots of data using the mouse. View how the mean, median, and mode change as entries are added to the plot.
AAA Math
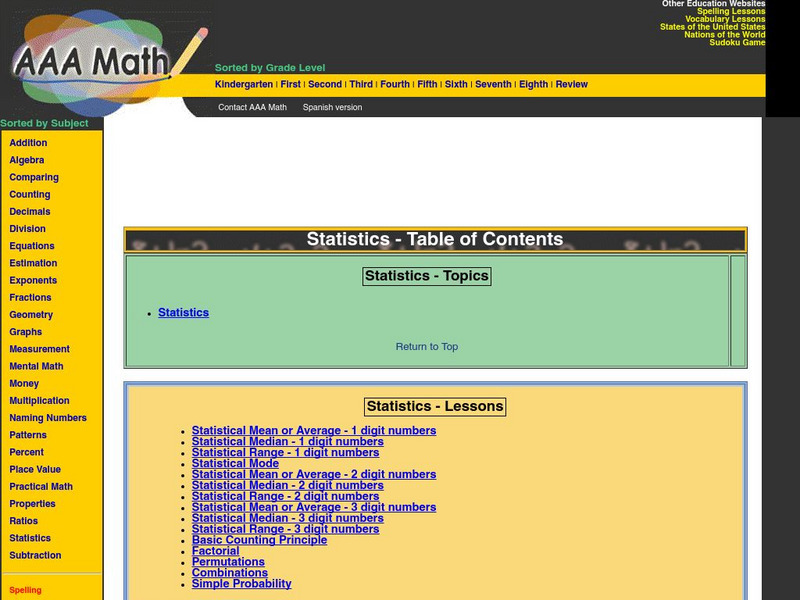
Aaa Math: Central Tendencies Notes
A complete description of mean, median and mode. Interactive games and practice exercises are included.
Beacon Learning Center
Beacon Learning Center: All That Data
Students analyze data by finding the mean, median, mode, and range of a set of numbers. Line plots, bar graphs, and circle graphs are also included in this lesson.
Other popular searches
- Mean Median and Mode
- Mean, Median and Mode
- Mean Median Mode and Range
- Mean, Median, and Mode
- Mean, Median, Mode, and Range
- Mean, Median, Mode and Range
- Mode, Mean and Median
- Mean, Median. Mode, and Range
- Mean and Median and Mode
- Mean\, Median and Mode


