Curated OER
Data Management and Probability: Applications
In this data management and probability applications instructional activity, 7th graders solve 13 different types of problems that include finding the mean, median, mode, and range of each set of values, as well as, solving a number of...
Curated OER
Energy Audit
Students collect data about energy usage and use mathematical calculations to analyze their data. In this energy conservation and statistics math lesson plan, students survey their homes to complete an energy usage worksheet. Students...
Curated OER
Are You My Little Peanut?
Fourth graders explore the mass and length of peanuts by pretending to parent a peanut. In this mode, median and range lesson students graph their measurements and then use them to find the mode, median and range. Students discuss peanut...
Newspaper Association of America
Power Pack: Lessons in Civics, Math, and Fine Arts
Newspaper in Education (NIE) Week honors the contributions of the newspaper and is celebrated in the resource within a civics, mathematics, and fine arts setting. The resource represents every grade from 3rd to 12th with questions...
Curated OER
Holly Leaves
Sixth graders analyze mathematics by participating in a botany activity. In this holly lesson, 6th graders identify if all holly leaves have the same amount of prickles by conducting a math survey. Students analyze many leaves and...
Curated OER
M&M's and the Scientific Method
Sixth graders explore the scientific method by conducting an in class experiment. In this scientific averages lesson, 6th graders discuss the concept of the scientific method, and define the different mathematical averages, mean, median...
Curated OER
Slopes, Hopes, & Speed
Students investigate the sport of skiing through Internet research in this multi-task lesson. They compare and generalize the results of five individuals by using mean, median, and mode.
Newspaper Association of America
By the Numbers: Mathematical Connections in Newspapers for Middle-Grade Students
A cross-curricular resource teaches and reinforces mathematical concepts with several activities that use parts of a newspaper. Scholars use scavenger hunts to find the different ways math is used in the paper along with using data...
Curated OER
Finding Averages
Fifth graders explore the world of statistics by finding averages. In this math formula lesson plan, 5th graders define the terms mean, median and mode while discussing the differences. Students practice finding the different...
Curated OER
Central Tendencies and Normal Distribution Curve
Fourth graders are given data (class test scores) to determine central tendencies, and find information needed to construct a normal distribution curve. They become proficient in calculating mode, median and average.
Curated OER
Create a Public Opinion Survey: The Middle East in the News
Though the discrete content here is a pair of New York Times articles about a 1998 military strike on Iraq and the coincident impeachment by the House of Representatives of then-President Clinton, this detailed plan for creating,...
Curated OER
Beary O'Mometer Learns About Careers In Meteorology
Students explore the field of meteorology. In this meteorology instructional activity, students explore weather-related careers as they research the field of study as well as various weather concepts. Students interview meteorologists,...
Curated OER
Graphing Made Easy
Fourth graders discover the appropriate way to construct and analyze bar, line, picto, and circle graphs. They set up frequency tables and perform some statistical analysis (mean, median, and mode) on their data.
Curated OER
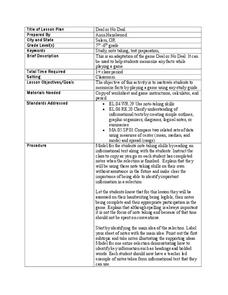
Deal or No Deal
Young scholars play a game in order to memorize any set of facts. For this memorization lesson, young scholars play an adaptation of the game Deal or No Deal to help them review and memorize factual information. Young scholars also work...
Curated OER
The Guise of a Graph Gumshoe
Eighth graders practice constructing bar, circle, and box-and-whisker graphs. They practice reading and interpreting data displays and explore how different displays of data can lead to different interpretations.
Curated OER
Statistics Newscast in Math Class
Young scholars study sports teams, gather data about the teams, and create a newscast about their data. For this sports analysis lesson, students research two teams and define their statistical data. Young scholars compare the two teams,...
Curated OER
Macbeth Madness
Students research Macbeth online and complete computer and graphing activities for the play. In this Macbeth activities lesson, students research Macbeth and bookmark the URL's. Students complete activities for the topic on spreadsheets...
Curated OER
What I Didn't Know...
Young scholars practice creating wikis. In this wiki lesson, students create a wiki about any math topic that they know nothing about. Young scholars learn about their topic and create a wiki that explains the math topic in detail.
Curated OER
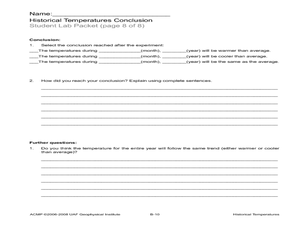
Historical Temperatures
Students research historical regional temperatures for their current season. In this historical weather lesson, students conduct weather station and Internet research to learn about historical regional temperatures. Students collect and...
Curated OER
Looking for More Clues
Fifth graders explore how to collect data and display it on a bar and circle graph.
Curated OER
Cars on the Curve
Second graders, using two dice, participate in a car race game called Cars on the Curve. They predict which car wins the game and records it in their Data Diary.
Curated OER
Graphing
Students collect data to create different types of graphs-line, pie, and bar graphs. They use StarOffice 6.0 to create graphs.
Curated OER
Harry Potter Research Project
Students work together to complete a research project on Harry Potter. They write a research question and develop a survey to give to their classmates. Using the results, they create a graph and draw conclusions about the data collected.
Curated OER
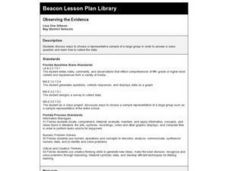
Observing the Evidence
Fifth graders explore how to do research from a large group. They explore how to choose a representative sample and collect data from it.


