Hi, what do you want to do?
Curated OER
Stem-and-Leaf Plots
In this stem-and-leaf plots worksheet, 9th graders solve and complete 9 various types of problems. First, they determine the mean, median, and mode of the stem-and-leaf plot shown. Then, students summarize the similarities and...
Curated OER
Describing Data
Your learners will practice many ways of describing data using coordinate algebra in this unit written to address many Common Core State Standards. Simple examples of different ways to organize data are shared and then practice problems...
Curated OER
Data Collection Project
Young scholars collect data using email. They calculate the mean, median, mode, range and outliers. They create a graph using the data results. They write five paragraphs to summarize their data.
Curated OER
How's The Weather?
Students make a box and whiskers plot using the TI-73 graphing calculator. Each student would have their own calculator but they would work in small groups of two or three to help each other enter the data and make the plots.
Curated OER
Height versus Shoe Size
Students find a correlation between a person's height and his/her shoe size. They have access to entering data into lists on a graphing calculator and can complete scatter plots. Students read and interpret a scatter plot and use the...
Alabama Learning Exchange
The State Capital of Stem and Leaf
Students explore the concept of stem and leaf plots. In this stem and leaf plots lesson, students plot the 50 US states' capitals on a stem and leaf plot according to the first letter of each state. Students compare...
Curated OER
Recognize, create and Record Simple Repeating Patterns
Students analyze, create, and record repeating patterns. In this geometry lesson, students create shapes using patterns and keep track of the different shapes. They incorporate transformation and reflections into their patterns.
Curated OER
Breakfast Cereal - How Nutritious Is Yours?
Students analyze the nutritional value of breakfast cereal in order to make an informed choice. They create a stem and leaf plot which analyzes the nutritional value of the cereal they eat on a regular basis. Students write a letter to...
Curated OER
Using Computers to Produce Spreadsheets and Bar Graphs
Students review graphing terminology and how to plot data points, how to input data into a spreadsheet, and how to make a chart using a computer.
Curated OER
Comparison of Two Different Gender Sports Teams - Part 1 of 3 Measures of Central Tendency
Students gather and analyze data from sports teams. In this measures of central tendency lesson, students gather information from websites about sports team performance. Students analyze and draw conclusions from this data. This lesson...
Curated OER
Box Plots on the TI-83 Calculator
Eighth graders research box plots on the Internet. They gather real life statistics and analyze the collected statistics by making multiple box plots on the TI-83 calculator.
Alabama Learning Exchange
I Know What You Did Last Summer: A Data Graphing Project
Young scholars participate in graphing data. In this graphing data lesson, students make a stem and leaf plot of their summer activities. Young scholars create numerous graphs on poster boards. Students discuss the...
Curated OER
Mapping River Statistics
Students research different statistics to do with the Mississippi River. They answer questions about finding data and collect it by conducting research. The research is used to construct a data table. Then students use the table to...
Varsity Tutors
Varsity Tutors: Hotmath: Practice Problems: Statistics
Fifteen problems presented on the topics: mean, median, mode, outliers and graphing statistics. They are given with each step to the solution cleverly revealed one at a time. You can work each step of the problem then click the "View...
Illustrative Mathematics
Illustrative Mathematics: S Id.3 Describing Data Sets With Outliers
For certain data sets, such as home prices and household or individual income, is often described using the median instead of the mean. This lesson explores the mean and median in some different situations to help you understand the...
Other
Stat Soft: Statistics Glossary
Dozens of statistical terms are defined and illustrated in this glossary.
Beacon Learning Center
Beacon Learning Center: Measures of Central Tendency (Middle School)
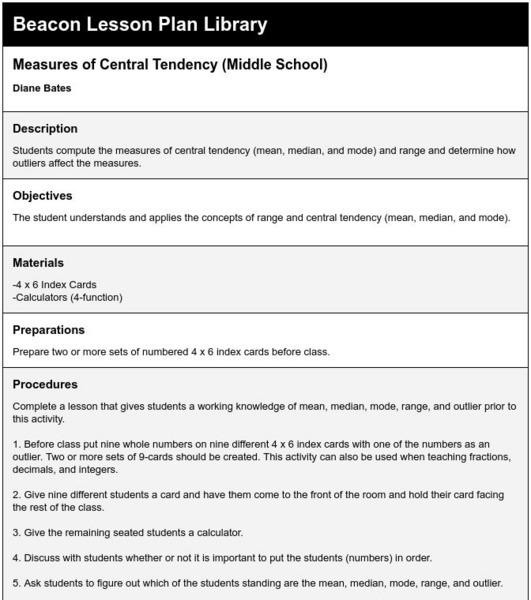
Lesson plan provides practice for calculating measures of center.
Education Place
Houghton Mifflin: Eduplace: Math Steps: What Is It? Data
This is a great place for lesson information on the concept of analyzing data - measures of central tendency. Three other tabs are available besides the "What Is It?" link. Tips and Tricks, When Students Ask, and Lesson Ideas also...


