Curated OER
Weather Instrument Data Chart 2
In this science worksheet, students look for the data that is needed to fill in the graphic organizer. The prefixes are given that are needed to sort the information as it is collected.
Curated OER
Measuring Water Vapor: The Microwave Water Radiometer (MWR)
Students investigate water vapor. They view and analyze photos, conduct Internet research, and analyze the total water vapor/total liquid water data plot.
Curated OER
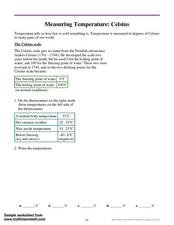
Measurement Temperature: Celsius
In this Celsius worksheet, students review the Celsius scale and then mark temperatures for the first thermometer. Students then study the temperatures on the thermometers and write the temperatures.
Curated OER
Wet-Dry Bulb Hygrometers: Measuring Relative Humidity and Apparent Temperature
Pupils work in groups of 4 for the activity/activity part of this exercise. They know that clouds are formed by the condensation of water vapor, affect weather and climate. Also that global patterns of atmospheric movement influence...
Curated OER
Measuring the Number Of Calories In Sunlight
Pupils., in groups, define calorie and compare the absorption of solar energy by three different collectors. They define solar constant and offer several explanations for discrepancies between the data collected and the solar constant.
Curated OER
Science-Observation Skill Builders
Pupils explore observation while making connections between observation skills and careers (like how farmers observe the weather). They view a variety of nature photographs on the computer and practice their observation skills by...
Curated OER
Basic Excel
Students explore basic Excel spreadsheets. For this spreadsheet lesson plan, students enter Alaska weather information and perform calculations. Students title the columns on the spreadsheet and format the cells. ...
National Wildlife Federation
Why All The Wiggling on the Way Up?
Some of the CO2 emitted by burning fossil fuels is removed from the atmosphere by natural sinks, such as the ocean. The fifth engaging activity in the series of 21 examines the CO2 data from three very different locations. It then makes...
Curated OER
Tracking Temperature
Students explore how to read a thermometer and what the instrument does. They practice measuring hot and cold objects and discuss changes in the weather based on temperature.
National Wildlife Federation
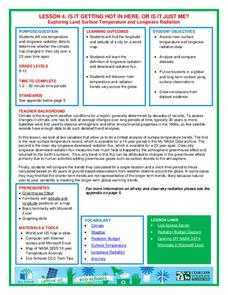
Is It Getting Hot in Here, or Is It Just Me?
Currently, only 2.1% of global warming is felt on continents, while over 93% is felt in the oceans. The fourth lesson in the series of 21 on global warming is composed of three activities that build off one another. In the first...
Curated OER
Conserving Fuel
In this conserving fuel worksheet, 7th graders solve and complete 4 different word problems that include measurement and total cost of products. First, the determine the gas station described that has the lowest price of gasoline. Then,...
National Wildlife Federation
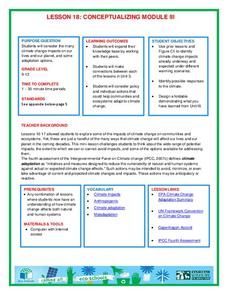
Conceptualizing Module III
Many researchers focus on one impact of climate change in isolation, but researchers gain a global perspective when they come together. A timely lesson teaches scholars about the projected impacts of global temperature increases. Then...
National Wildlife Federation
The Tide is High, but I’m Holding On… Using ICESat Data to Investigate Sea Level Rise
Based on the rate of melting observed from 2003-2007 in Greenland, it would take less than 10 minutes to fill the Dallas Cowboys' Stadium. The 17th lesson in a series of 21 has scholars use the ICESat data to understand the ice mass...
Curated OER
Too Heavy For Me
Students explore the different arrangement of air molecules in high and low air pressure masses. They compare the temperature of high and low pressure masses and discover how a barometer works.
Scholastic
Study Jams! Tell Temperature
Weather watchers are introduced to temperature scales using step-by-step animated slides. The Home set explains the Fahrenheit scale on a thermometer, while the Watch Out! set introduces Celsius. A Try It! tab contains two guided...
Curated OER
Drought Threatens Huge Man-Made Lake
Students locate Lake Mead, then read a news article about Lake Mead drying up and how that would effect water and power supplies to the region. In this current events lesson, the teacher introduces the article with a map and vocabulary...
Curated OER
Layers of the Atmosphere Foldable
Aspiring meteorologists make themselves a tool for reviewing the characteristics of each layer of the atmosphere. The procedure for this little project divides the paper into five sections, but many earth science teachers opt for the...
Curated OER
Create a Country
Young scholars work in small groups to list features and elements found on a variety of grade- appropriate maps. They develop a class list of map features and elements to draw from as they create a map of an imaginary country.
Curated OER
Thunderstorm Outflow I
Students study the characteristics of thunderstorms. They view an animation of radar reflectivity that depicts a thunderstorm and its outflow to locate the thunderstorm's outflow. Afterward, they explain what physical process occurs in a...
Curated OER
Your Own El Nino
Learners conduct an experiment. In this El Nino lesson plan, students learn where El Nino storms come from, what they consist of and what effects they have. Learners also complete an experiment where they create a miniature...
Curated OER
How Do Weather Conditions and Lunar Cycles Affect Fishing Success?
Students use weather measuring devices to record and study weather conditions at different locations, during different times. They attempt to draw conclusions about the relationship between weather conditions, lunar cycle and fishing...
Curated OER
Measuring Rainfall
In this activity, students will make a gauge to measure rainfall and see how much rain falls over several days.
Curated OER
Weather temperatures
Students investigate the given statistics about temperatures in cities around the nation in order to look for a pattern. They measure the mean, median, and mode for the data set of temperatures.
Education World
Every Day Edit - The Big Wind
In this everyday editing worksheet, learners correct grammatical mistakes in a short paragraph about the strongest wind ever measured. The errors range from punctuation, capitalization, grammar, and spelling.
Other popular searches
- Tools Measuring Weather
- Tools for Measuring Weather
- Measuring Weather Activities
- Measuring Weather Changes
- Measuring Weather Conditions
- Measuring Weather Worksheets
- Weather, Measuring Tools


