Hi, what do you want to do?
Curated OER
Probability Experiment
Students do an experiment with probability. In this probability lesson, they listen to part of the book G is for Googol: A Math Alphabet Book by David M. Schwartz. They complete 3 probability experiments and check to see how close...
Curated OER
Global Warming Statistics
Students research real-time and historic temperature data of U.S. and world locations, and analyze the data using mean, median, and mode averages. They graph the data and draw conclusions by analyzing the data. A spreadsheet is used to...
Curated OER
Monitoring Estuarine Water Quality
Students analyze water quality data from real data. In this environmental science lesson, students examine how salinity and dissolved oxygen affect the living organisms in the estuary. They interpret graphs to support or disprove a...
Curated OER
Tracking the Storm
Pupils discuss the different types of storms that can hit land. They locate specific coordinates on a plane grid. They discuss lonsgitude and latitude to plot the coordinates of a tropical storm. They practice finding coordinates that...
Curated OER
Weather... Or Not
Students observe and discuss the local weather patterns, researching cloud types and weather patterns for cities on the same latitude on the Internet. They record the data for 6-8 weeks on a graph, and make weather predictions for their...
Curated OER
Water in the Texas Coastal Basins
Students, after researching a Texas coastal basin, map and graph the information they collect and then translate it into a short report to be presented to their classmates. They brainstorm unique ways to maintain Texas estuaries as well...
Curated OER
Comparing Local, National, International Biomes
Learners calculate averages of climate sets of data. In this ecology instructional activity, students analyze data to determine identity of a biome and collect meteorological data to understand process. Learners also compare data...
Curated OER
Physics Rewind
Eighth graders differentiate speed and velocity. For this physics lesson, 8th graders explain Newton's laws of motion. They calculate speed using a mathematical formula.
Curated OER
Building A Topographic Model
Students visualize, in three dimensions, features represented by contour lines on a topographic map. They see that the different elevations shown on a two dimensional topographic map can be used to build a 3-D model.
Center for Innovation in Engineering and Science Education, Stevens Institute of Technology
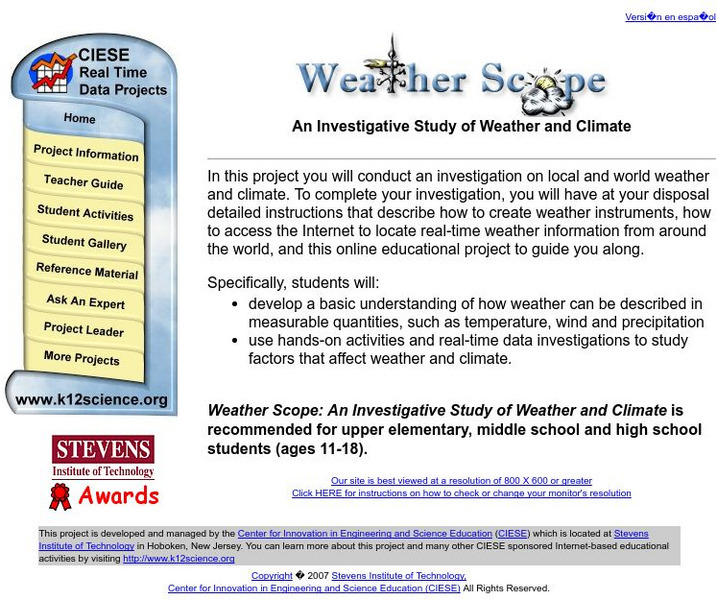
Ciese Real Time Data Projects: Weather Scope: A Study of Weather and Climate
Use real-time data to study factors that affect weather and climate, create weather instruments, and share data with students around the world.
Illustrative Mathematics
Illustrative Mathematics: S cp.a.2/a.3/a.5 and S cp.b.7: Rain & Lightning
This task uses the same situation to explore different concepts of probability theory. Aligns with the S-CP.A.2.; S-CP.A.3; S-CP.A.5; and S-CP.B.7 standards.
Houghton Mifflin Harcourt
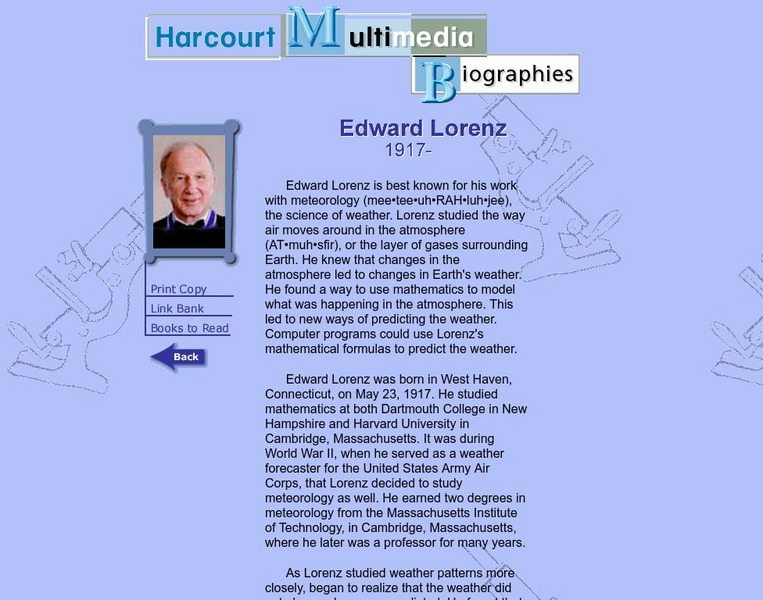
Harcourt: Biographies: Edward Lorenz
This is an interesting biography about Edward Lorenz. It discusses his ideas about meteorology, such as using mathematical formulas to predict the weather, and his butterfly effect theory.


