Hi, what do you want to do?
Curated OER
Water: On the Surface and in the Ground
Young scholars explore the differences between surface water and ground water. They collect data using maps and graphs and investigate a Texas river basin and a nearby aquifer. They complete a written report including maps and data...
NASA
Sci Jinks: Learn Satellite Meteorology
A collection of learning modules is offered to enhance studying meteorology. This opportunity should peek students' interests as they work through geoscience, physics, chemistry, and applied sciences. Each module includes exercises and...
NASA
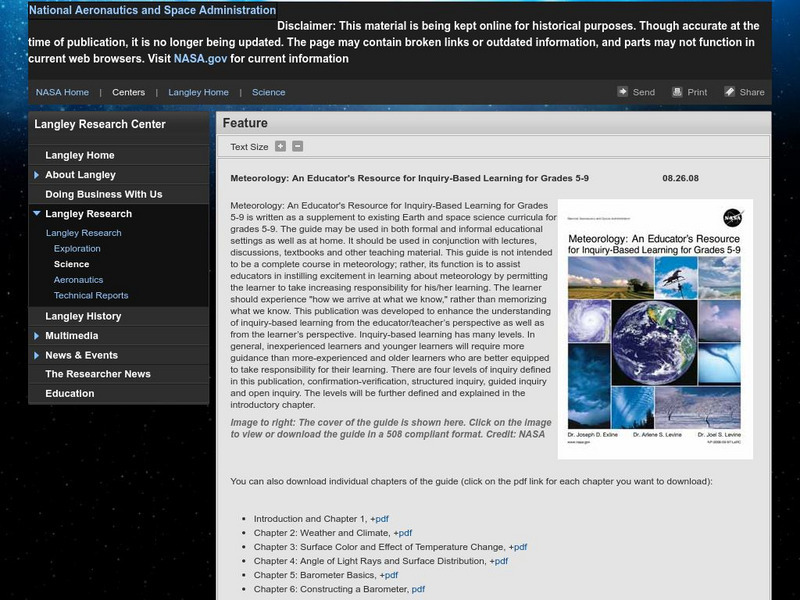
Nasa: Meteorology
Educator's resource guide to be used as a supplement to existing curriculum and to enhance the understanding of inquiry-based learning from both the educator/teacher's perspective as well as from the learner's perspective. Individual...
Science Buddies
Science Buddies: Predicting the Weather
Here's a good way to get yourself on TV. This science fair project will help you learn how to predict the weather. So who knows, maybe you'll be more accurate than your local meteorologist.
University of Wisconsin
The Why Files: Science Behind the News
The Why? Files from the University of Wisconsin explains the science behind the news. The website, tackling issues in news headlines, provides a good mix of information and interactivity that takes the "chore" out of learning.
CK-12 Foundation
Ck 12: Earth Science: Branches of Earth Science Study Guide
Review the main study areas of Earth Science.
Other
Ams: Career Guides for the Atmospheric Sciences
Career guides for aspiring meteorologists from the American Meteorological Society.
Discovery Education
Discovery Education: Science Homework Help
The science section of this popular homework helper site features links to chemistry, life, earth, physical, and space science resources.
Other
Science Fairs Homepage: Senior Projects
This resource from the Eastern Newfoundland Science Fairs Council provides really substantial projects for senior High School students. These are online topics, six areas, with about 10-20 topics per area.
CK-12 Foundation
Ck 12: Plix: Branches of Earth Science
[Free Registration/Login Required] An interactive concept map that shows how the different branches of earth science. After completing the concept map, students can test their knowledge with a "challenge me" quiz.
Science Education Resource Center at Carleton College
Serc: Recording the Weather Around Us Using a Science Notebook in Second Grade
In this investigation, students will observe the weather and use weather terminology to document data in a science notebook. They will continue to observe and record their weather data throughout the year, looking for changes due to...
NOAA
Noaa: Atlantic Oceanographical and Meteorological Laboratory
The AOML researches oceanography, tropical meteorology, atmospheric and oceanic chemistry and acoustics in order to understand the physical characteristics of the ocean and atmosphere. Explore science in action!
Other
Fisher Science Education: Headline Discoveries Archive
What's new in the world of science? Find the latest articles about the newest discoveries and research in all the science disciplines: anatomy, astronomy, biology, biotechnology, chemistry, consumer science, environmental, forensics,...
Ducksters
Ducksters: Earth Science for Kids: Weather Forecasting and Meteorology
On this website, students can learn about weather forcasting and meteorology including cold and warm fronts, high and low pressure systems, fun facts, and technology.
Science Education Resource Center at Carleton College
Serc: Hands on Meteorology
A collection of interactive concept models and active learning materials for teaching meteorology that illustrate conceptually difficult processes in atmospheric science. Active learning exercises are provided as guided instruction to...
Other
Cdli: Science Fairs Homepage
At this site from the Center for Distance Learning and Innovation there's a monstrous listing of possible science fair projects. You can choose from primary (grades 1-4), elementary (grades 4-6), intermediate (grades 7-9), or senior...
Pennsylvania State University
Pennsylvania State University: Bad Science
This site from the Pennsylvania State University is maintained to provide teachers and students with examples of the bad science often taught in schools, universities, and offered in popular articles and textbooks.
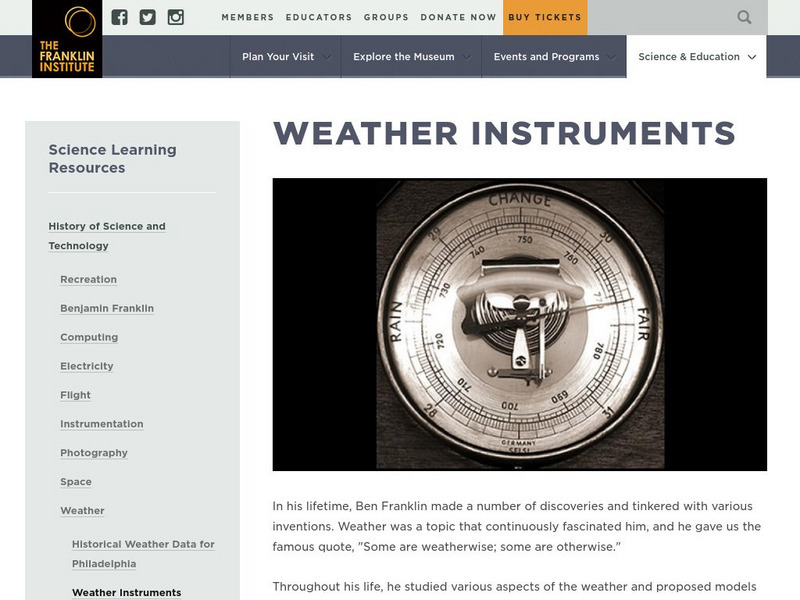
The Franklin Institute
Franklin Institute: History of Science and Technology: Weather Instruments
A look back in time at weather instruments used in previous centuries. Includes pictures and descriptions of instruments from Franklin Institute's historical collection.
Other
Cornerstone Networks: Fourth Grade Science Lesson 1
This site, designed as a fourth-grade lesson plan, focuses on the earth's atmosphere with information on prevailing winds.
Science Struck
Science Struck: Different Branches of Geography
Learn about the many specializations in the field of geography within its two branches of physical and human geography.
Texas Instruments
Texas Instruments: Science Today When the Snow Is as High as an Elephant
Using information from the USA TODAY Infograph, "When snow is as high as an elephant" and data from other sources, students will explore some of the effects and characteristics of snow. This activity asks students to examine topics such...
Oklahoma Mesonet
Oklahoma Climatological Survey: Heat Transfer
A discussion from the Oklahoma Climatological Survey of the thermal factors effecting the movement of air masses in the atmosphere. Numerous topics such as methods of heat transfer, latent heat, phase changes (including sublimation and...
Stephen Byrne
History for Kids: Ancient Chinese Science
History for Kids overview on the science and innovations of ancient China. Students learn about the significant impact China made on the world with contributions in the fields of astronomy, chemistry, physics, meteorology and seismology.
Curated OER
Weather Dude: Meteorology
Weather site highlights the science of meteorology. Discover what it is and the basic reason as to why we have weather.


