Hi, what do you want to do?
Google
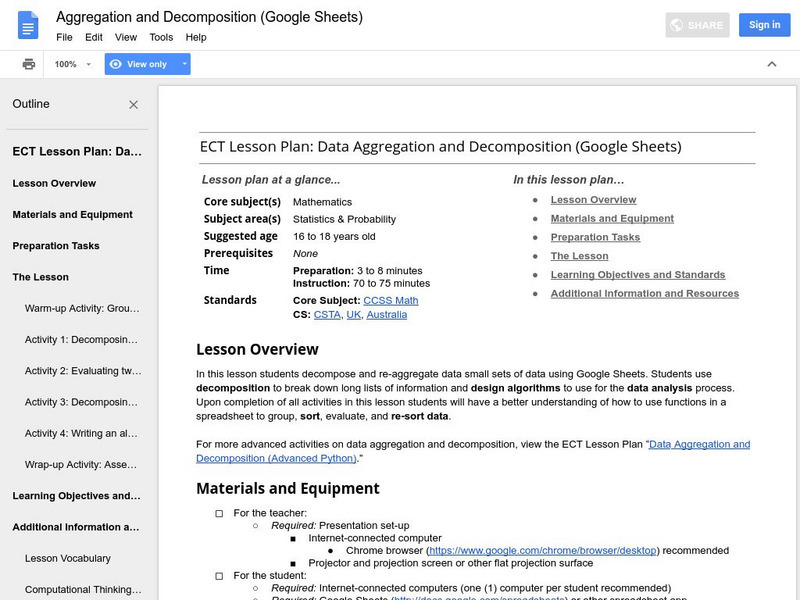
Google for Education: Data Aggregation and Decomposition (Excel)
By using Microsoft Excel, students collect, decompose, and re-aggregate class data. Students use computational thinking skills by decomposing long lists of information and writing basic algorithms to help analyze data.
Google
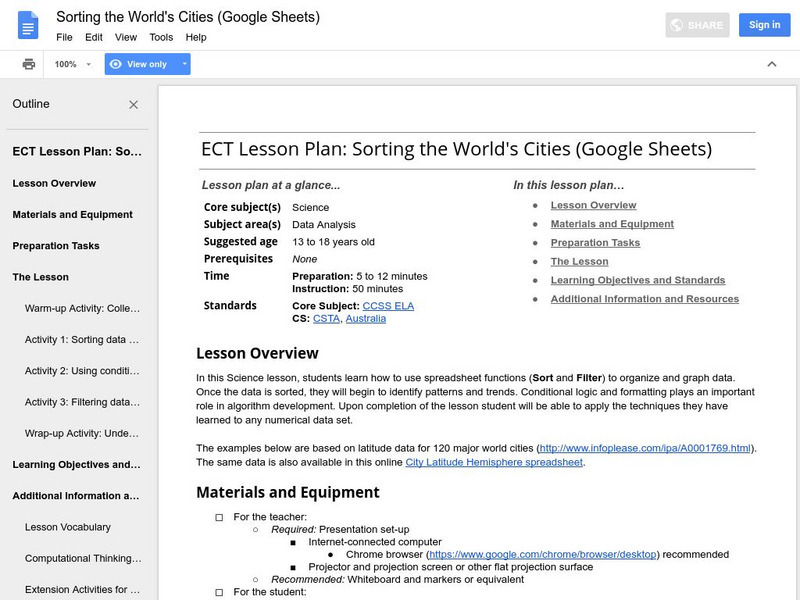
Google for Education: Sorting the World's Cities (Excel)
Young scholars learn to organize, sort, and display data in a Microsoft Excel spreadsheet using latitude data for 120 major world cities.
Science Education Resource Center at Carleton College
Serc: Using Microsoft Excel to Explore Gravity Forces and Accelerations
Students will learn about the force of gravity and the factors that affect it, and use and analyze the universal gravitation equation using Excel spreadsheets.
Other
Laus Dnet: Grade 5 Excel Lesson Plan
In this online activity, students will survey students in their school to determine their favorite type of hand-held ice cream. Before performing the survey, students will make predictions about which ice creams they think will be the...
Council for Economic Education
Econ Ed Link: Using an Excel Checkbook
Students will use a spreadsheet to enter checkbook transactions and reconcile.
Microsoft
Microsoft Education Lesson Plan: Making Money From Lemons
Simulation where learners apply mathematics and economics concepts in the lemonade business. Learners set up a virtual lemonade stand and must determine production costs, product variables, and profits. Students record data collected on...
Science Education Resource Center at Carleton College
Serc: Exploring Regional Differences in Climate Change
Learners create a set of graphs that facilitate comparison of climate change predicted for various states. They also use Microsoft Excel to create a graph showing precipitation data.
Science Education Resource Center at Carleton College
Serc: Creating a Household Budget
In this Spreadsheets Across the Curriculum PowerPoint module, students create a household budget by tracking their expenditures over a month-long period. Students use Microsoft Excel to create a spreadsheet to track their own...
Science Education Resource Center at Carleton College
Serc: The Digital Divide: A Data Analysis Activity Using Subtotals
A lesson plan that includes a PowerPoint learning module for students. The purpose of the lesson is to teach how to use Excel to analyze a large amount of data, in this case from the US Census. The example being used is the accessibility...
TeachEngineering
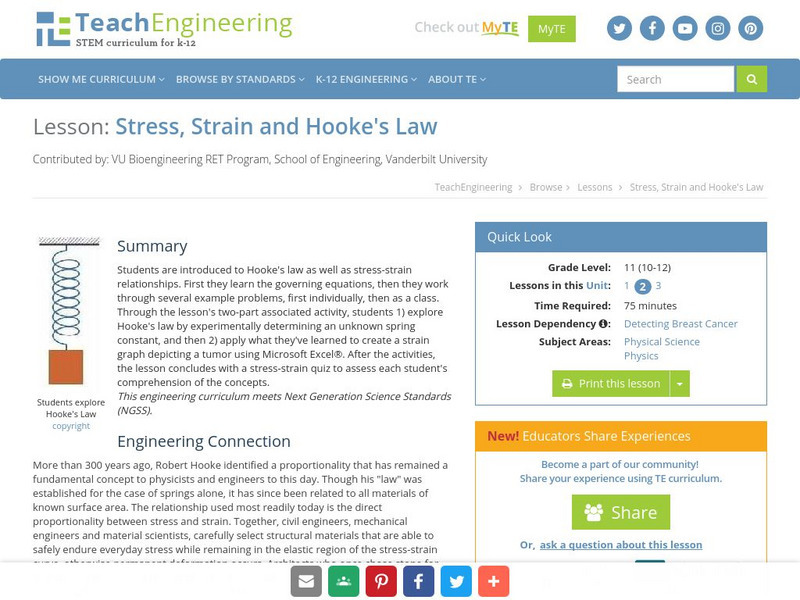
Teach Engineering: Stress, Strain and Hooke's Law
This lesson offers an introduction to Hooke's Law as well as stress-strain relationships. Students will first learn the governing equations. Then students will work through several example problems first individually, then as a class. In...
TeachEngineering
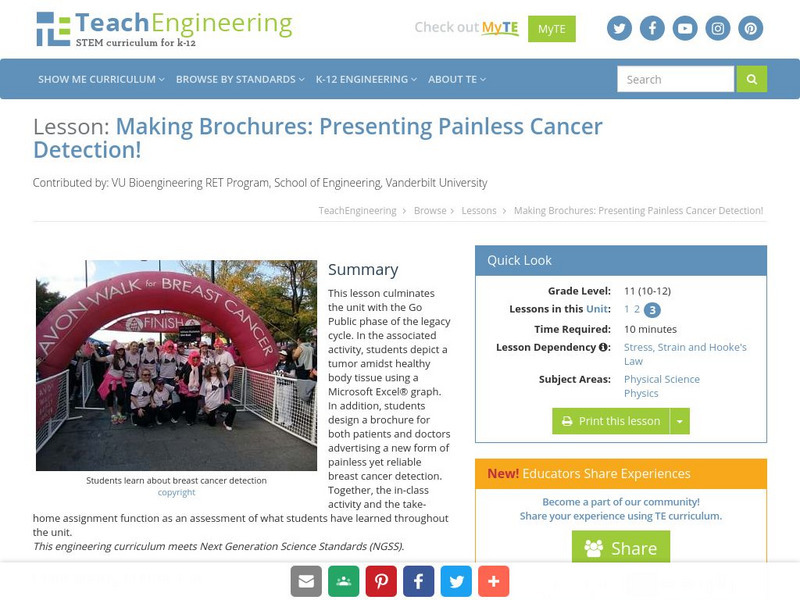
Teach Engineering: Presenting Painless Breast Cancer Detection!
This lesson culminates the unit with the Go Public phase of the legacy cycle. In the associated activity, students must depict a tumor amidst healthy body tissue using a graph in Microsoft Excel. In addition, students will design a...
Science Education Resource Center at Carleton College
Serc: Quantitative Reasoning and Analytical Writing in a Global Climate Change
In this lesson plan students use Microsoft Excel to manipulate and statistically analyze large climate databases of precipitation., temperature, stream discharge, tree ring data, ice core data, and ENSO to determine climate relationships...
Other
Personal: Let's Go Shopping
This personal site provides a student activity that allows learners to practice spreadsheet skills in inputting data and creating function formulas. The activity is based on the collection and comparison of shopping receipts using max,...
Other
Tonya Skinner Business Ed Lesson Plans: Grocery Shopping
This personal site provides a student activity that allows learners to plan a class party while organizing the budget details in a spreadsheet program. Learners will demonstrate computer skills in inputting data, formatting data, and...
Alabama Learning Exchange
Alex: Statistically Thinking
The object of this project is for students to learn how to find univariate and bivariate statistics for sets of data. Also, the students will be able to determine if two sets of data are linearly correlated and to what degree. The...
Other popular searches
- Microsoft Excel Spreadsheets
- Microsoft Excel Lessons
- Microsoft Excel 2003
- Microsoft Excel Projects
- Beginning Microsoft Excel
- Microsoft Excel Lesson Plans
- Microsoft Excel Formulas
- Microsoft Excel Navigation
- Microsoft Excel Basics
- Microsoft Excel 2007
- Microsoft Office Excel 2007
- Microsoft Excel 2003 Lessons


