Hi, what do you want to do?
Council for Economic Education
Loan Amortization - Mortgage
When you buy a home for $100,000, you pay $100,000—right? On the list of important things for individuals to understand, the lesson presents the concept of interest rates and loan amortization using spreadsheets and online sources....
Curated OER
Plan A Trip Anywhere
Students role play being an international travel agent that is planning a trip for a client. The teacher gives specific details associated with the trip. They choose the destination and work out some of the other details. Students...
Curated OER
Scientific Method and Graphing
Seventh graders use the scientific method to determine how many seeds are in a watermelon.
Curated OER
Interest Calculation and Spreadsheets
Students, while in the computer lab working on a spreadsheet program, calculate interest and accumulated value of a savings plan. They follow specific directives on how to create their spreadsheets. At the end of the lesson they print...
Curated OER
Linear and Exponential Growth
Students explore the concept of linear and exponential growth. In this linear and exponential growth instructional activity, students collect data about China's population. Students model the data to determine if it is linear or...
Curated OER
Eyes on the Estuaries
Students study estuaries and compare several ones in the U.S. In this estuary lesson students interpret data and compare the distribution of different species.
Curated OER
Getting Into Shapes: Identifying and Describing Two-Dimensional Shapes
Young scholars examine their classroom to find examples of various types of shapes. After identifying and describing the various shapes, they draw as many as they can on a piece of paper. They organize them into an image based on their...
Curated OER
Technobiz
Students examine candy preferences to create a plan in order to improve candy sales. In this technobiz lesson plan, students build spreadsheet and organizational skills by graphing and calculating data. Students are introduced to...
Curated OER
My Community
First graders design a Powerpoint presentation to reflect information about their community. In this community lesson plan, 1st graders create slides to explain the weather, geography and other information about the city.
Curated OER
Cell Size Changes
Learners examine the behavior of living cells treated with different types of stimuli. They watch an online movie, examine wet mount slides under a microscope, take an online quiz, and analyze data.
Curated OER
Summer Trip
Fourth graders search for information and directions to specific cities from their homes, figure cost of trip when given miles per gallon, distance, and cost per gallon of gas, develop outline budget for summer trip, and draw and label...
Curated OER
Just Graph It!
Fourth graders evaluate various graphs for the best way to reflect statistical data. They use a spreadsheet to organize data and generate varied graphic representations. They select the graph they feel best shows their results.
Curated OER
Weather Or Not
Students use the internet to find pen pals to share in their weather experiment. Individually, they research the high and low temperatures for cities within the United States and email the results to their pen pal. They also develop a...
Curated OER
How is Your Driver Doing?
Sixth graders explore the concept of averaging of numbers and the function of a spreadsheet. Data is collected, analyzed, and displayed in this lesson. The NASCAR race results provides the basis for the collection of data.
Curated OER
Thanksgiving Dinner
Students plan a traditional Thanksgiving dinner. In this Thanksgiving lesson, students compare and contrast the first Thanksgiving to Thanksgiving celebrations today. Students plan a traditional Thanksgiving dinner and research the costs...
Curated OER
Beginning PowerPoint Presentation
Students create a beginning PowerPoint presentation that can be used for any subject area.
Curated OER
Clay Animation
Eighth graders create a visual story without using words. A study of the history and process of clay animation is explored and discussed. Students storyboard a plot of a story and students divide up into groups designing characters and...
Curated OER
Sled Kite
Young scholars make and fly a sled kite out of plastic garbage bags, dowel rods, and more. In this kite lesson plan, students plan the kite to have symmetry and make adjustments as they test it.
Curated OER
High School Sikh Lesson Plan
Students examine post 9/11 backlash. In this hate crimes lesson, students watch "Dastaar," a documentary featuring Sikh discrimination. Students discuss their impressions of the documentary.
Curated OER
Laetoli Trackway Puzzle
Students try to reach a "best explanation" after viewing diagrams. In this trackway lesson students complete several worksheets, make observations and hypothesize.
Google
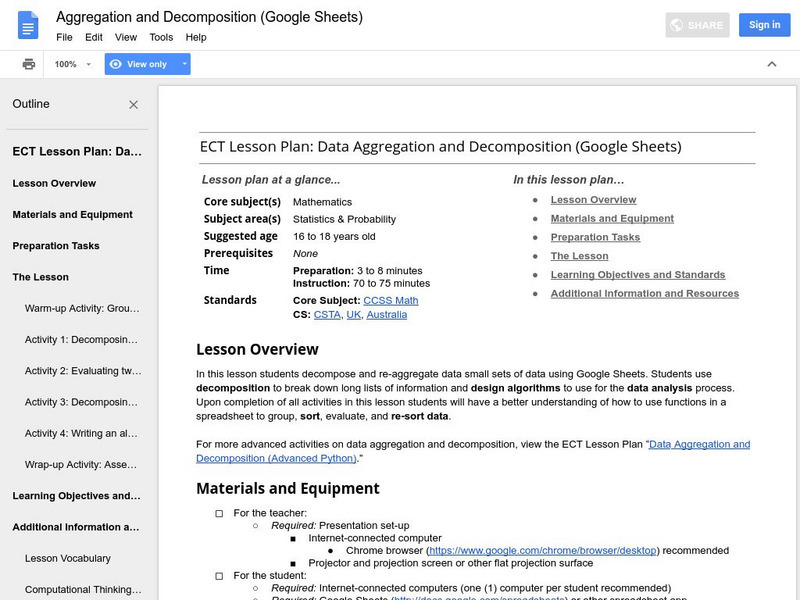
Google for Education: Data Aggregation and Decomposition (Excel)
By using Microsoft Excel, students collect, decompose, and re-aggregate class data. Students use computational thinking skills by decomposing long lists of information and writing basic algorithms to help analyze data.
Other
Laus Dnet: Grade 5 Excel Lesson Plan
In this online activity, students will survey students in their school to determine their favorite type of hand-held ice cream. Before performing the survey, students will make predictions about which ice creams they think will be the...
Microsoft
Microsoft Education Lesson Plan: Making Money From Lemons
Simulation where learners apply mathematics and economics concepts in the lemonade business. Learners set up a virtual lemonade stand and must determine production costs, product variables, and profits. Students record data collected on...


