Curated OER
Excel temperature Graphs
Students gather data about the weather in Nome, Alaska. In this Nome Temperature lesson, students create an excel graph to explore the weather trends in Nome. Students will find the average weather and add a trend line to their graph.
Teach Engineering
Understanding the Air through Data Analysis
Is there a correlation or causation relationship between air pollutants? Groups develop a hypothesis about the daily variation of air pollutants, specifically ozone and CO2. Using Excel to analyze the data, the groups evaluate their...
Curated OER
Law of Large Numbers - Hospital
Students explore concepts of probability and independent events. They develop a formula for deviation percentage.
Curated OER
Graphing and Analysis of Water Quality Reports
Young scholars practice making graphs and interpreting them. They compare and contrast different sets of data. They use Microsoft Excel to create different types of graphs.
Curated OER
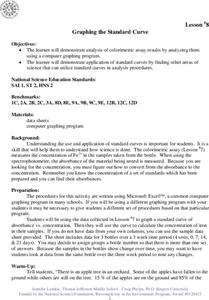
Graphing the Standard Curve
Srudents demonstrate analysis of colorimetric assay results by analyzing them using a computer graphing program and demonstrate application of standard curves by finding other areas of science that can utilize standard curves in analysis...
Curated OER
Don't Trash the Earth
Students experience a hands-on environmental science project. They access about recycling as they collect data on their own family's trash production. Students analyze the data with worksheets, chart the data, and present their findings.
Discovery Education
Sonar & Echolocation
A well-designed, comprehensive, and attractive slide show supports direct instruction on how sonar and echolocation work. Contained within the slides are links to interactive websites and instructions for using apps on a mobile device to...


