Curated OER
Doing Math with Hudson River Shipping
In this Hudson River shipping worksheet, middle schoolers record information about various vessels seen on the Hudson River and respond to the questions that follow. They determine how many miles the Gypsum Baron traveled from one place...
Curated OER
The Big Apple: Beginning Estimation and Math Skills, Working With Data
In this basic mathematics worksheets, students answer a set of 9 questions based on an "apple." Students then write 2 paragraphs discussing conclusions they have drawn from their data.
Curated OER
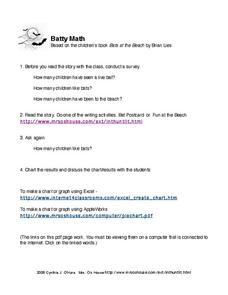
Batty Math
In this bats worksheet, students click on the link to read a story about bats and then answer short answer questions, take a survey, and create graphs about it. Students complete 4 tasks total.
Curated OER
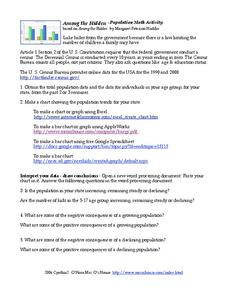
Among the Hidden - Population Math Activity
In this population activity, students collect data on population by researching the Census Bureau and then make online graphs and answer short answer questions about the data. Students complete 5 problems total.
Curated OER
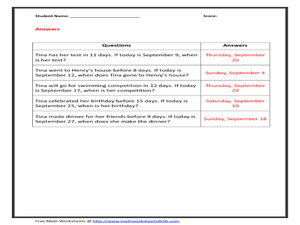
Math Calendar Activity
For this calendar worksheet, learners use a calendar shown to answer a set of 5 questions. An answer key is included on page 2. A reference web site for additional activities is given.
Curated OER
Math Star Challenge B: Levels 1-10
In this multiplication worksheet, students provide correct computations illustrating their understanding of the concept by multiplying single-digit numbers 2-9. There are 100 problems to solve.
Curated OER
Math Star Challenge C: Levels 1-10
In this multiplication worksheet, students provide correct computations illustrating their understanding of the concept by multiplying single-digit numbers 2-9. There are 100 problems to solve.
Curated OER
Easter Math
In this Easter activity worksheet, students examine 2 sets of Easter pictures and count how many Easter bunnies are in each set. Students may color the pictures as well.
Curated OER
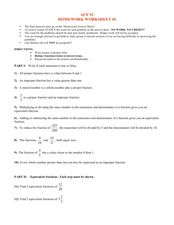
Math Homework: Fractions
In this fractions worksheet, students complete true/false questions, find equivalent fractions and use order of operations to solve problems that included exponents.
Curated OER
Math Worksheet: Area (3)
In this area worksheet, students find the area of one irregular polygon. Students find the area by dividing the irregular polygon into multiple regular polygons.
Ms. Amber Nakamura's Mathematics Website
Algebra Project
What would your dream house look like? A cottage? A medieval castle? High schoolers enrolled in Algebra design the perfect house while using slopes to write equations for various aspects of the project.
Curated OER
Hemlock Trees and the Pesky Pest, The Woolly Adelgid
Students review Excel and how to create graphs with this program. They create two graphs in Excel, one showing the average number of woolly adelgid egg sacks on the outer 15 cm of hemlock branch at sites sorted by latitude, then one...
Curated OER
Data Lesson Vital Information
Students prepare and collect data and use excel and create a graph. They collect data about the number of pattern blocks that are put on tables. Students then record that data in Excel.
Curated OER
Excel Lesson
Students explore data and Excel spreadsheets. They collect data about political candidates. Students enter the data into a chart on Excel. They create a graph using the data and Excel.
Curated OER
Counting
First graders explore collecting data. They collect data using a data collection sheet and enter the data into Excel. Students create graphs using Excel. They share their graphs with the class.
Curated OER
How Big Is Your Head?
Students explore measurement by measuring classmates' heads. They record their measurements and they put the measurements in order from smallest to largest. Students figure the mean, median, mode, maximum, minimum, and range of their...
Curated OER
What's your favorite pi?
Sixth graders toss popcorn kernels at a 12? circle inscribed in a 12? square. By counting the number of popcorn kernels that land inside the circle and inside the square the students calculate estimates for the value of pi.
Curated OER
Mound Math
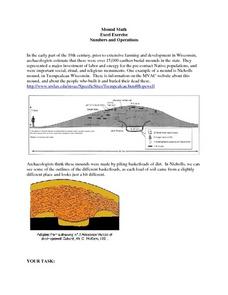
Learners examine the many different burial mounds in Wisconsin. In groups, they use the internet to discover how long it took to build a specific mound. They must calculate the measurements of the mound to make a scale model.
Curated OER
Mammal Math
In this math word problems activity, learners read the following questions carefully and answer the math problems. Students show their work and include the complete unit of measure in their answer.
University of Kansas
Newspaper in the Classroom
Newspapers aren't only for reading—they're for learning skills, too! A journalism unit provides three lessons each for primary, intermediate, and secondary grades. Lessons include objectives, materials, vocabulary, and procedure, and...
Curated OER
Beginning Graphs in MS Excel
Students practice creating graphs in Microsoft Excel. In this technology lesson, students conduct a random survey and collect data. Students use the Microsoft Excel program to create a bar graph of the data.
Curated OER
How to Graph in Excel
Fourth graders construct data graphs on the Microsoft Excel program. In this statistics lesson plan, 4th graders formulate questions and collect data. Students represent their results by using Excel.
Curated OER
Piecewise Linear Functions and Excel
In this linear function worksheet, students use Excel worksheets to solve piecewise linear functions. They plot functions and produce piecewise linear functions. This six-page worksheet contains detailed instructions on how to use...
Curated OER
Analyze The Learner; Chocolate Fractions
Third graders describe, represent and compare fractions using pieces of a chocolate bar. In this fractions lesson, 3rd graders demonstrate how to read and write fractions correctly. Students then integrate technology by using...


