Curated OER
How Many Legs Does Your Animal Have?-- Class Graph
In this science and math worksheet, students plot information about their chosen animal on a bar graph. Kids indicate how many legs their animal has. This appears to be intended for a large group of students in comparing animals.
Curated OER
Are Yellow, Green, Or Red Apples Your Favorite To Eat?-- Class Bar Graph
In this math worksheet, students collaborate to complete a bar graph about favorite apples. Students plot the information from their class on a simple bar graph.
Curated OER
What Does Your Bean Seed Look Like Today?-- Class Bar Graph
In this math/science worksheet, students who are already beginning to grow a bean seed record what it looks like on a given day. Detailed pictures of different growth stages are provided on the class graph.
Curated OER
What Do You Like for Breakfast?-- Class Bar Graph
In this math worksheet, 3rd graders collaborate as a class to complete a bar graph showing what everyone prefers for breakfast. Students choose from pop tart/ breakfast bar, cereal, pancakes/waffles, or eggs. Students record the class...
Curated OER
How Many of Each Coin Do We Have in Our Bag?-- Class Bar Graph
In this math worksheet, students participate in a group project to record the kind of coins they pick at random from a bag. Students record the data on this classroom bar graph.
Curated OER
What Sport Do You Like To Play the Most?== Class Bar Graph
In this math worksheet, students participate in making a group bar graph about their favorite sports. Students are surveyed and the responses plotted on a graph.
Curated OER
Which Time of Day Do You Like Best?-- Class Bar Graph
In this math worksheet, students collaborate in making a bar graph which displays their favorite time of day: art, music, gym or library. The class is surveyed and responses are plotted on this graph.
Curated OER
What Do You Like on Top of Your Pizza Most? --class Bar Graph
In this math worksheet, students participate in completing a bar graph as a class. Students survey classmates as to their favorite pizza toppings and plot the results on this bar graph.
Curated OER
What Do You Like on Your Popcorn?-- Class Bar Graph
In this math learning exercise, students participate in a class bar graph activity. Students survey classmates as to their popcorn preferences: nothing, butter or salt. Results are plotted on the graph.
Curated OER
How Do You Like Your Sandwich? --class Bar Graph
In this math worksheet, students participate in a group bar graph activity. Students survey their classmates on favorite sandwich choices: peanut butter and jelly, grilled cheese or meat. Results are plotted on a bar graph.
Curated OER
How Many Days Did It Take for Your Bean Seed To Germinate?--class Bar Graph
In this math/science worksheet, students collaborate as a class to create a bar graph which displays the germination time for bean seeds. Students survey their classmates and plot results on a graph.
Curated OER
How Many Brothers And Sisters Do You Have? -- Class Bar Graph
In this math worksheet, students collaborate in generating a class bar graph which displays information about how many brothers and sisters each classmate has. Data is plotted on a bar graph.
Curated OER
Which Kind of Weather Do You Like Best? -- Class Bar Graph
In this math worksheet, students generate a class bar graph. Classmates are surveyed about favorite weather: sunny, rainy, snowy, cloudy or windy. Results are displayed on a bar graph.
Curated OER
When Do You Brush Your Teeth? --Class Venn Diagram
In this math worksheet, students collaborate to make a tally mark Venn diagram which shows what time of day students brush their teeth: morning, evening or both.
Curated OER
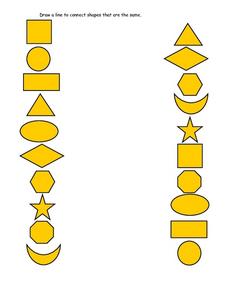
Connect the Shapes That Are the Same
For this math/visual discrimination worksheet, students analyze a column of 10 common geometric shapes. Students draw a line to the matching shape in the second column.
Curated OER
How Many Forest Animals Are Around the Tree?
In this math activity, learners learn counting from 1 to 10 by cutting out pictures of different forest animals. Students use the small cards for counting, then paste the desired number around the tree picture.
Curated OER
Coordinates
In this math worksheet, students take turns asking each other questions about a given grid. Students answer by giving the coordinates of the number.
Curated OER
The Two Coin Problem
In this math worksheet, students look for the answers to the 17 applications of looking at the outcomes of flipping two coins. They also graph the results.
Curated OER
Percentage Game
In this math activity, students find the winning values of the percentages while playing the game of percents using the wheel organizer.
Curated OER
Introduction to Decimals
In this math worksheet, students are introduced to decimals by first studying pattern blocks showing a number with tens, ones and tenths. Students locate decimals on number lines and rulers and shade decimal pictures. Students compare...
Curated OER
Polyhedra Book
In this math instructional activity, students are asked to read the book that focuses upon the creation and explanation of three dimensional shapes.
Curated OER
Solve for X
For this math worksheet, students solve for the variable by dividing a whole number or mixed number by a fraction. Five of the problems ask students to compute the answer. Five problems are multiple choice. Answers are included after the...
Curated OER
Worksheet 8
In this math worksheet, students examine the functions that are given. The domains and ranges are varied according to each function. Then they write the proofs for them.
Curated OER
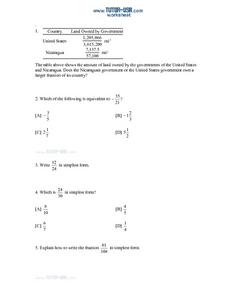
Application Problems with Fractions
In this math worksheet, students compare fractions from a chart. They simplify six fractions. Students tell the fraction of a day they spend doing various activities. Each fraction is simplified. Three problems are multiple choice problems.


