Hi, what do you want to do?
University of North Carolina
University of North Carolina Writing Center Handouts: Statistics
When presenting an argument, the use of statistics to support a point can be very effective. This handout offers advice on both how to read statistics so that you understand exactly what they mean, and how to use them in your argument so...
Houghton Mifflin Harcourt
Holt, Rinehart and Winston: Homework Help Independent Practice: Misleading Graphs and Statistics
Get independent practice working with misleading graphs and statistics. Each incorrect response gets a text box explanation and another try. Correct responses are confirmed.
TED Talks
Ted: Ted Ed: How Statistics Can Be Misleading
Statistics are persuasive. So much so that people, organizations, and whole countries base some of their most important decisions on organized data. But any set of statistics might have something lurking inside it that can turn the...
ibiblio
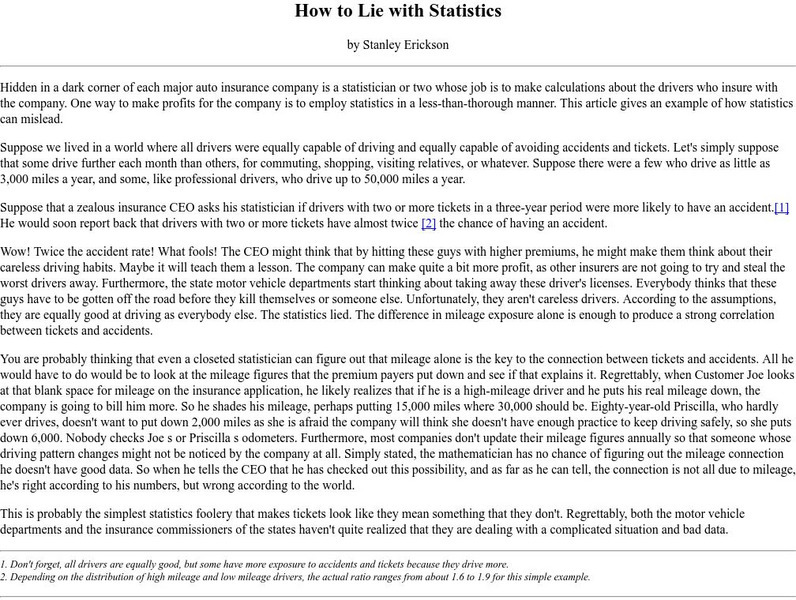
Ibiblio: How to Lie With Statistics
A real-world example of how statistics can be used to lie. In this case, it is the issue of speed limits and insurance premiums.
SMART Technologies
Smart: Sampling and Misleading Graphs
Teachers can use Smart Exchange to download a SMART Notebook lesson covering the topic of sampling and misleading graphs.
Alabama Learning Exchange
Alex: Misleading Graphs Are Da'pits!
In this interactive lesson, students will discover how creating an incorrect graph will display misleading information. Through viewing and discussing a variety of graphs, the students will identify 5 components that graphs must contain...
Other
American College of Physicians: Misleading Cancer Statistics
An article from "Effective Clinical Practice," a past publication of the American College of Physicians, details the biased presentation of breast cancer danger and how it affects public perception. [Published March/April 2001]
BBC
Bbc: Representing Data
This BBC Math Bite tutorial for line graphs, pictograms, and frequency polygons features an exam in which students draw and interpret statistical diagrams.


