Curated OER
Stem-and-Leaf Plots
Seventh graders study steam-and-leaf plots. Given specific data, they create a stem-and-leaf plot . Students identify the mean, mode, range and median. Afterward, they review vocabulary words.
Curated OER
Statistics
High schoolers log their computer usage hours. They determine the mean, median, mode and standard deviation of the collected data. They make a frequency histogram of the grouped data, both on graph paper, and on the TI 83+ graphing...
Curated OER
Statistics
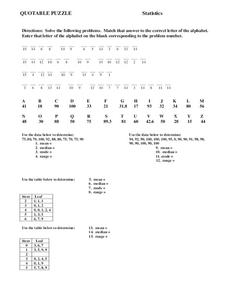
In this statistics worksheet, 8th graders solve and complete 15 different problems. First, they solve each problem by using the data given to determine the mean, median, mode, and range for each set. Then, students match that answer to...
Curated OER
Lesson 56
Sixth graders practice Least Common Multiple in fractions. In this fraction lesson, 6th graders look at two different fractions and find a common denominator. They sing a song to memorize mean, median, and mode.
Curated OER
Geometry Review
In this math review worksheet, students calculate the mean, median, mode, range, line segments, angles, and standard deviation for number and word problems. Students complete 11 problems.
Curated OER
Doing The School Run
Students explore finding the percent of a numbers. They survey their peers to determine modes of transportation used in getting to school. Afterward, students organize information and create graphs and charts. They explore alternative...
Curated OER
Family Size
In this family size worksheet, students complete a tally chart to determine data from a family size line plot. They organize the data in the chart to determine the mean, median, mode, and range of the data. There are six problems in...
Curated OER
Stem-and-Leaf Plots
In this stem-and-leaf plots worksheet, 8th graders solve and complete 3 different problems that include creating stem-and-leaf plots to solve problems. First, they determine the median, minimum, range and mode of the given set of numbers...
Curated OER
Statistics
In this statistics worksheet, 8th graders solve 4 problem sets related to an introduction to statistics. First, they find the range of each set of data. Then, students find the median and mode of each set of data. In addition, they...
Curated OER
Data Analysis Self-Test
In this data analysis activity, students complete 1 problem that has 7 parts involving mean, median, mode, range, and quartiles. Students then perform 5 operations with matrices.
Curated OER
Chapter Books
In this line plot worksheet, students create a line plot of the chapter books read by the students of a class and find the median and mode. Students complete 3 tasks.
Curated OER
Digger and the Gang
Help online friends Digger and Sprat from the BBC series to solve math problems! In a series of activities, your class will use data sets to calculate measurements, averages, means, and probabilities. The class completes worksheets and...
Curated OER
Line Plots - Homework 6.3
Elementary schoolers use data in a table to make a line plot, then answer five related questions. Houghton Mifflin text is referenced.
Curated OER
What is the Average Height of Your Class?
For this statistics lesson, learners use an on-line form generator create a class-specific form, then complete the form, view a graph and data analysis, and draw conclusions.
Curated OER
Using Averages
In this math worksheet, students compute the range, mean, median and modal weight of candy bars from two machines. Students write a short essay about which machine is using too much chocolate and which is more reliable.
Curated OER
Latino Literature: Poetry
Under construction, this lesson focuses on Canto Familia, a collection of poetry about Gary Soto's experiences growing up in California's Imperial Valley. Representative of the experiences of many Latinos, the poems also address themes...
Curated OER
Mean, Median and Mode
Students define mean, median, mode and outliers. In this statistics lesson, students analyze data using the central tendencies. They follow a path through a maze collecting data. They analyze the data using the mean, median and mode.
Curated OER
Find the Range #1
In this mean, median, mode, and range worksheet, students find the mean, median, mode, and range of a group of one digit numbers with numbers up to 9. Students complete 6 problems total.
Curated OER
Measures of Central Tendencies: Quartiles
In this statistics worksheet, students calculate the mean, median, mode, range, lower quartile, and upper quartile for 10 questions and interpret a box and whiskers graph.
Curated OER
U.S. Immigrant Statistics
Young scholars compare the populations of ten U.S. states to the number of immigrants who entered those states in a given year and calculate the mean, mode, and median of the grouping. They discuss why some states are more attractive...
Curated OER
Measures of Central Tendency
In this measures of central tendency learning exercise, students find the mean, mode and range of given sets of data. They interpret box-and-whisker graphs and stem-and-leaf plots. This two-page learning exercise contains eleven...
Curated OER
Advanced Matching- Modes of Transportation
In this transportation worksheet, students study the different modes of transportation. Students match 11 terms to the correct definition that is provided.
Curated OER
Frequency Table
In this frequency table learning exercise, students create a frequency table from given data. They identify the mode. Students read and interpret frequency tables. This one-page learning exercise contains 7 multi-step problems.
Curated OER
Data Analysis
In this data analysis worksheet, students answer 4 questions using a weather report chart. Topics include mean, median, mode and range.
Other popular searches
- Mean, Median, Mode
- Modern
- Modern Dance
- Mean Median Mode
- Modern Art
- Array Model of Multiplication
- Bohr Model
- Modes of Transportation
- Dna Models
- Graphing Mean, Median, Mode
- Free Mean, Median, Mode
- Math; Mean, Median, Mode


