Curated OER
Estimation & Central Tendency
Eighth graders view pictures that show many objects, estimate amount that they think they saw, and take class data from estimation to find the mean, median, mode, and range for the class.
Curated OER
Investigation - How Tall is the Average Sixth Grader?
Students will measure each other and record the data in inches. They will use a stem and leaf plot to display data and figure out the average height of the students in a class. The other statistical data will be collected like the mode...
Curated OER
Capture/Recapture
Students use proportions to estimate the size of populations. They describe the data with using a graph or table of the estimate. Students use descriptive statistics to calculate mean, median, and mode. They also compare and contrast an...
Curated OER
Through India and Back
Students play a game based on "The Amazing Race" to practice using rates and fractions. In this fractions and rates instructional activity, students work in small groups competing to complete the tasks in the quickest time. At each stage...
Curated OER
Statistics of Mars
Students explore the concept of central tendencies. In this central tendencies lesson, students sort M&M's or Skittles based on color. Students graph their results. Students find the mean, median, and mode of their data.
Curated OER
The History of American Transportation
Eleventh graders describe different modes of transportation, discuss how transportation has changed throughout history, and describe why transportation is important to them.
Curated OER
Prairie Math
Students work together to build models of prairie plants. Using the model, they estimate the height and then measure them using metric and standard units. They write a fraction to represent their part of the whole set and compare and...
Curated OER
Data Analysis
For this data analysis worksheet, learners solve and complete 6 different problems that include using various types of data analysis. First, they create a stem-and-leaf plot of the ratios shown at the top and determine the mean, median,...
Curated OER
Central Tendency
Fifth graders compare and contrast different sets of data on the basis of measures of central tendency.
Curated OER
An Introduction to Elementary Statistics
Students explain and appreciate the use of statistics in everyday life. They define basic terms used in statistics and compute simple measures of central tendency.
Curated OER
Finding Averages
Fifth graders explore the world of statistics by finding averages. In this math formula lesson plan, 5th graders define the terms mean, median and mode while discussing the differences. Students practice finding the different...
Curated OER
Introduction to Descriptive Statistics with Mode, Median, Mean and Range
Learners complete several games and experiments, tally and graph their results. They figure the mean, median, range and/or average of their graphs to describe class results. They consider which statistic best represents the data at hand.
Curated OER
Iron Oxide Lab: Incorporating Math and Science
Students conduct an experiment in small groups, draw conclusions about the amount heat of a compound achieves and practice their data analysis skills.
Curated OER
Box Plots
Students review the concept of median, explore how to calculate quartiles for any size data set and experience how to build a box plot.
Curated OER
Connecting Measurement
Students participate in activities the connect measurement to geometry, statistics, estimation, and the real world. They collect measurements from their elbow to the tip of their middle finger and make a box plot of the data as well as...
Curated OER
Averages and Percentages
In this averages and percents learning exercise, students identify and define average as all numbers together divided by the total number of items added. Then they identify and define percent as the given number out of a total possible....
Curated OER
Middle Most Numbers and Division
For this middle most numbers worksheet, students examine a set of given data. They place the numbers in order from least to greatest and identify the mean of the set. This one-page worksheet contains six division problems.
Curated OER
Holly Leaves
Sixth graders analyze mathematics by participating in a botany activity. In this holly lesson, 6th graders identify if all holly leaves have the same amount of prickles by conducting a math survey. Students analyze many leaves and...
Curated OER
Independent Practice 1: Box and Whisker Plot
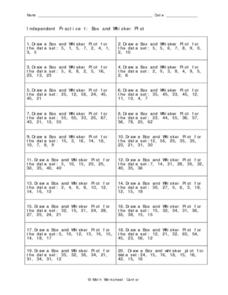
In this box and whisker plot activity, students create a box and whisker plot from a given set of data. They identify the lower quartile, upper quartile, the mean, and outliers. This one-page activity contains 20 sets of numbers from...
Curated OER
Stem and Leaf Plots
In this stem and leaf plots learning exercise, students solve and complete 10 different problems that include designing stem and leaf plots. First, they use the table on the left to determine the least score and the range of the total...
Inside Mathematics
Suzi's Company
The mean might not always be the best representation of the average. The assessment task has individuals determine the measures of center for the salaries of a company. They determine which of the three would be the best representation...
David Pleacher
Candy Math Fun
Few things can motivate children to learn like the promise of a sweet and tasty treat. Given a bag of M&M®s, Skittles®, or other colorful candy, students first predict the contents of the bag before counting the pieces,...
CK-12 Foundation
Understand and Create Histograms: Histograms
Determine the shape of weight. Using the interactive, class members build a histogram displaying weight ranges collected in a P.E. class. Scholars describe the shape of the histogram and determine which measure of central tendency to use...
Other popular searches
- Mean, Median, Mode
- Modern
- Modern Dance
- Mean Median Mode
- Modern Art
- Array Model of Multiplication
- Bohr Model
- Modes of Transportation
- Dna Models
- Graphing Mean, Median, Mode
- Free Mean, Median, Mode
- Math; Mean, Median, Mode


