Illustrative Mathematics
Illustrative Mathematics: F Le Us Population 1982 1988
In this task, students are shown a table of U.S. population data between 1982 and 1988 and are asked to explore whether linear functions would be appropriate to model relationships within the data. Aligns with F-LE.B.5 and F-LE.A.1.b.
Illustrative Mathematics
Illustrative Mathematics: F if a Sse Modeling London's Population
In this task, students are shown a table of population data for the city of London and are asked to explore whether a linear, quadratic, or exponential function would be appropriate to model relationships within the data. They are next...
Texas Instruments
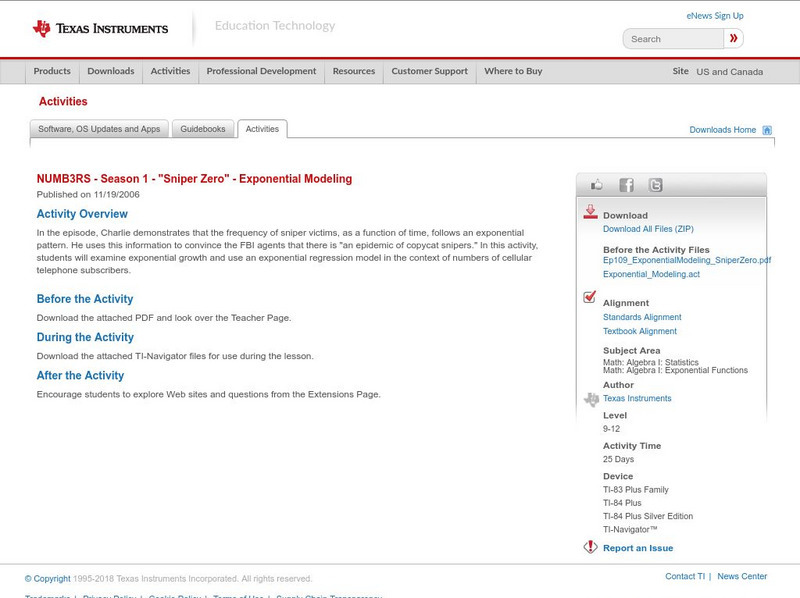
Texas Instruments: Numb3 Rs: Exponential Modeling
Based off of the hit television show NUMB3RS, this lesson introduces students to exponential equations, their graphs, and their application in the real world. The lesson is framed in the context of the number of cell phone users for a...
Illustrative Mathematics
Illustrative Mathematics: S Id, F if Laptop Battery Charge
This task uses a situation that is familiar to students to solve a problem they probably have all encountered before: How long will it take until an electronic device has a fully charged battery? Given data, students perform a variety of...
Texas Instruments
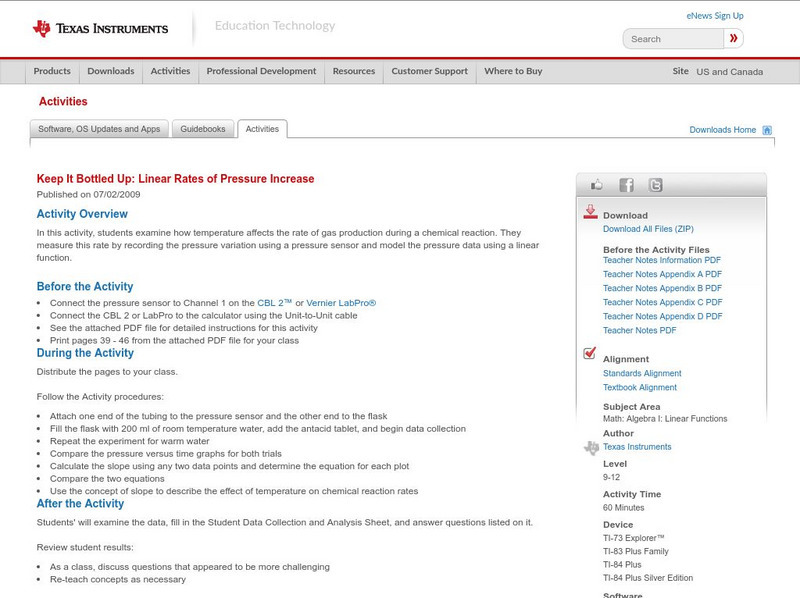
Texas Instruments: Keep It Bottled Up: Linear Rates of Pressure Increase
In this activity, students' examine how temperature affects the rate of gas production during a chemical reaction. They measure this rate by recording the pressure variation using a pressure sensor and model the pressure data using a...
Texas Instruments
Texas Instruments: Getting Started With Ti Navigator: Exploring Linear Model
This lesson introduces students' to Activity Center. In this activity, students will explore data on Women's Olympic 400 Meter Freestyle Swimming records. Concepts of domain and range will be investigated in the context of this problem...
Vision Learning
Visionlearning: General Science: The Scientific Method
Instructional module focusing on the scientific method as a process of investigation into the natural world rather than a linear collection of facts. Site also includes an interactive practice quiz and links relating to the topic.
Wikimedia
Wikipedia: Linear Regression
Wikipedia explains the statistics term, "linear regression." Includes table of contents, hyperlinked terms, and formulas.
Texas Instruments
Texas Instruments: Home for the Holidays
Thanksgiving Holiday activity for Algebra students. Linear data taken from the internet and used to create a linear model of the class data.Students will then discover the slope of the line is the speed of the car in miles per hour....
Texas Instruments
Texas Instruments: Math Today for Ti Navigator System More of u.s.
Using the USA TODAY Snapshot, "More of U.S.," students will learn how to interpret data presented in a graphical form. Students will determine the rate of change (slope) and build a linear model (y = mx + b) from this data. The model...
Illustrative Mathematics
Illustrative Mathematics: F Le Boiling Water
Students are shown two tables of data showing the approximate boiling point of water at different elevations. Both data sets can be modeled by linear functions but with different slopes. When the tables are combined, however, students...
Illustrative Mathematics
Illustrative Mathematics: F Le Basketball Bounces, Assessment Variation 2
This task asks learners to analyze a set of data about the height of a basketball for each time it bounces. They choose a model that reasonably fits the data and use the model to answer questions about the physical context. This second...
Texas Instruments
Texas Instruments: Math Today Wildfire Deaths
In this activity, students will be asked to use the "Wildfire deaths" data to determine a linear model. They will examine the affect an outlier has on the model and compare methods to determine the best model.
Texas Instruments
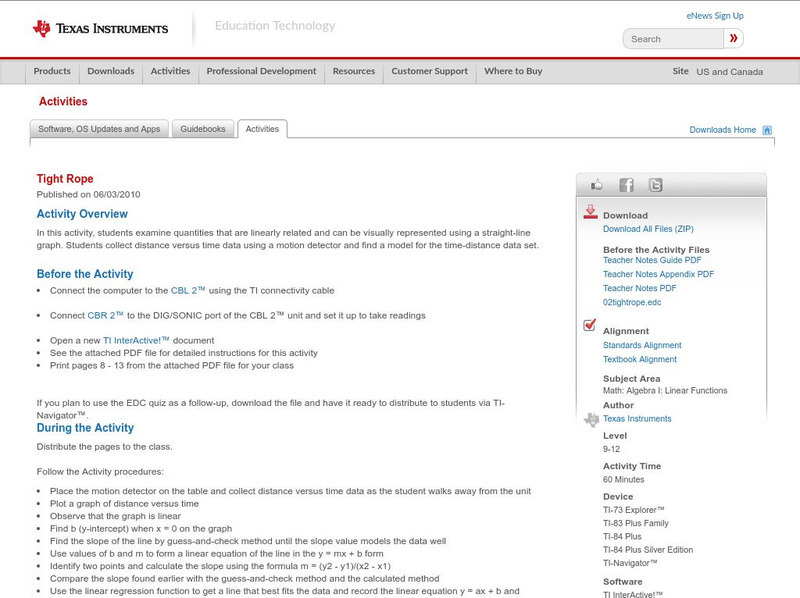
Texas Instruments: Tight Rope
In this activity, students examine quantities that are linearly related and can be visually represented using a straight-line graph. Students collect distance versus time data using a motion detector and find a model for the...
Texas Instruments
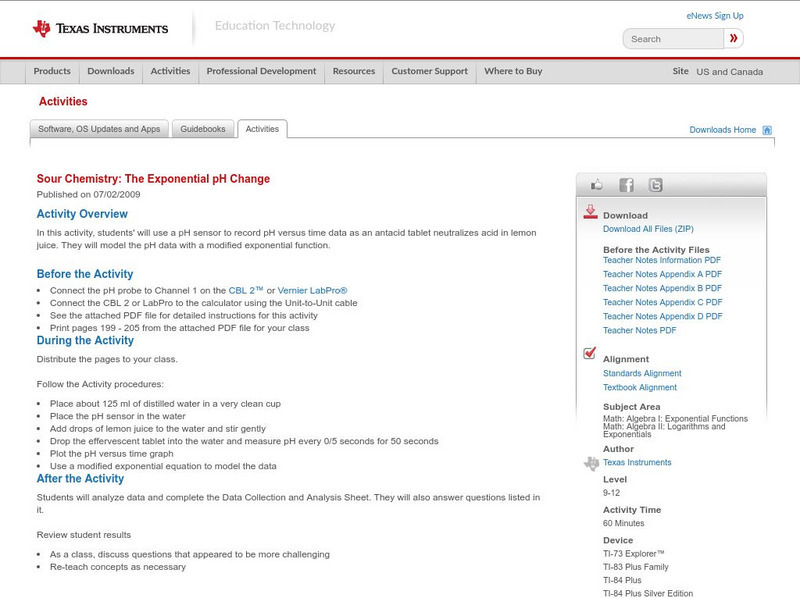
Texas Instruments: Sour Chemistry: The Exponential P H Change
In this activity, students' will use a pH sensor to record pH versus time data as an antacid tablet neutralizes acid in lemon juice. They will model the pH data with a modified exponential function.
Texas Instruments
Texas Instruments: Warming Up to Heating Curves
In this activity, students use the CBL 2 to collect temperature data as a sensor warms up in a cup of water. They find an appropriate mathematical model for the resulting data set.
Illustrative Mathematics
Illustrative Mathematics: F Le Sandia Aerial Tram
For this task, students examine data on the elevation and the minutes into a ride for a tram that is traveling up a mountain and write an equation for the function that models the relationship between the two variables. Aligns with...
Math Graphs
Houghton Mifflin: Math Graphs: Fitting Models to Scatter Plots 1 [Pdf]
Learners use a scatter plot to determine whether data can be modeled by a linear function, a quadratic function, a trigonometric function, or that there appears to be no relationship between x and y. The resource consists of an enlarged...
Math Graphs
Houghton Mifflin: Math Graphs: Fitting Models to Scatter Plots 2 [Pdf]
Students use a scatter plot to determine whether data can be modeled by a linear function, a quadratic function, a trigonometric function, or that there appears to be no relationship between x and y. The resource consists of an enlarged...
Math Graphs
Houghton Mifflin: Math Graphs: Fitting Models to Scatter Plots 3 [Pdf]
Learners use a scatter plot to determine whether data can be modeled by a linear function, a quadratic function, a trigonometric function, or that there appears to be no relationship between x and y. The resource consists of an enlarged...
Math Graphs
Houghton Mifflin: Math Graphs: Fitting Models to Scatter Plots 4 [Pdf]
Students use a scatter plot to determine whether data can be modeled by a linear function, a quadratic function, a trigonometric function, or that there appears to be no relationship between x and y. The resource consists of an enlarged...
Math Graphs
Houghton Mifflin: Math Graphs: Fitting Models to Scatter Plots 7 [Pdf]
Learners use a given scatter plot to identify whether the data can be modeled by a linear, quadratic, or trigonometric function. The math graph is available in PDF format.
Math Graphs
Houghton Mifflin: Math Graphs: Fitting Models to Scatter Plots 8 [Pdf]
Learners use a scatter plot to identify whether the data can be modeled by a linear, quadratic, or trigonometric function. The math graph is available in PDF format.
Other
Stat Soft: Statistics Glossary
Dozens of statistical terms are defined and illustrated in this glossary.


