National Council of Teachers of Mathematics
Nctm: Figure This: Math Challenges for Families
Students, teachers, and parents alike will enjoy this challenging math site. It contains a clever brain teaser section plus creative problems related to algebra, geometry, measurement, numbers, statistics, and probability. A Spanish...
Texas Instruments
Texas Instruments: Math Today for Ti Navigator System Cropland Value Grows
Students will create a scatter plot for the data in the USA TODAY Snapshot, "Cropland value grows," and identify the independent and dependent variables for the data. The students will find the rate of change for the data and label this...
Texas Instruments
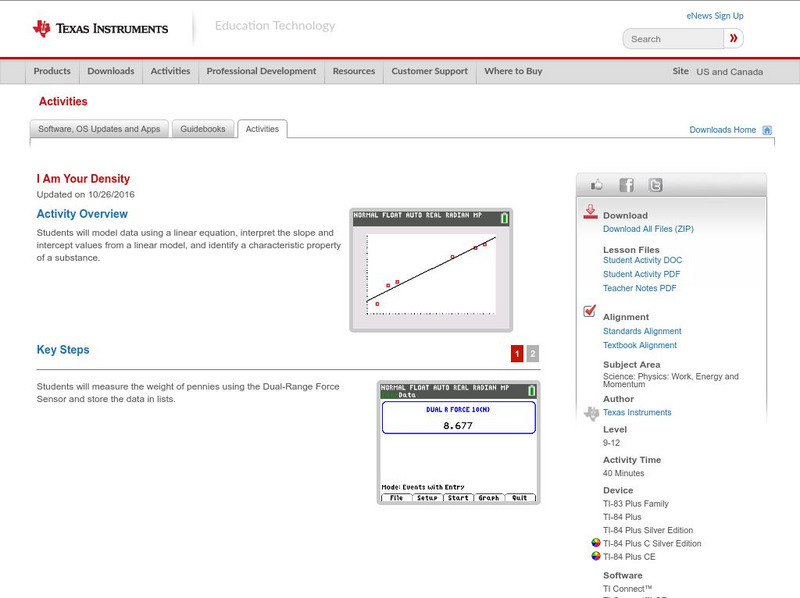
Texas Instruments: I Am Your Density
In this activity you will: Model data using a linear equation; interpret the slope and intercept values from a linear model; identify a characteristic property of a substance; and examine the relationship between mass, volume, and density.
Texas Instruments
Texas Instruments: Graph It in Pieces: Piecewise Defined Functions
In this activity, students' will record motion data for a walker and describe segments of the walker's motion using linear function. They will model the motion data using a piece-wise continuous function assembled from linear functions.
Texas Instruments
Texas Instruments: Math Today Population on the Move
In this activity students will determine the rate of change (slope) & build a linear model (y = mx + b) from this data. The model will be used to make a prediction about the future growth of the population of the U.S. if the current...
Texas Instruments
Texas Instruments: Math Today for Ti Navigator System Humidity Makes Air Feel
Using data from the USA TODAY graphic "Humidity makes air feel hotter" students will explore linear functions to determine how well they model the relationship between air temperature and heat index. When the model has been determined...
Illustrative Mathematics
Illustrative Mathematics: F Le Identifying Functions
In this task, students are shown a table with linear, quadratic, and exponential functions at various values of x and are asked to match the function type to each data set and explain their reasoning. Aligns with F-LE.A.1.b and F-LE.A.1.c.
Texas Instruments
Texas Instruments: Titration Curves: An Application of the Logistic Function
In this activity, Students can use a pH sensor to record pH versus base volume data for an acid base titration. They will manually model the curve using a logistic function.
University of Cambridge
University of Cambridge: Maths and Sports: Project Ideas: World Records
This activity suggests a number of investigative projects, focusing on athletics and swimming, exploring some of the trends between performances in different sports at the same time in history and in the rate of improvement of records...
Texas Instruments
Texas Instruments: Ball Bounce
This activity allows students to use real data obtained by them to model quadratic equations. students can use the TI-83 and/or TI-84 and a motion detector to collect their data. The students will then manually fit both quadratic and...
Texas Instruments
Texas Instruments: Women's 5000 M World Record Progression: Median Median Line
In this activity, students will collect the Women's 5000 meter progression of world record data and find the median - median line and the linear regression for the data. They will investigate the appropriateness of each of the models.
Texas Instruments
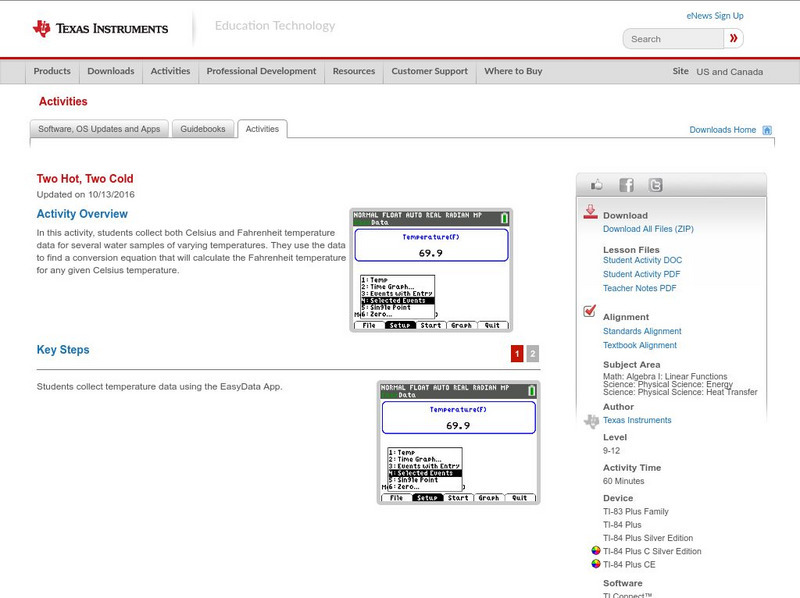
Texas Instruments: Two Hot, Two Cold
In this activity, students collect both Celsius and Fahrenheit temperature data for several water samples of varying temperatures. They use the data to find a conversion equation that will calculate the Fahrenheit temperature for any...
Texas Instruments
Texas Instruments: Burning Volumes
An analysis of how the volume of various jars impacts the burning time of candles. Data collected will be used to explore modeling, line fitting and linear regression Using graphing calculators.
Texas Instruments
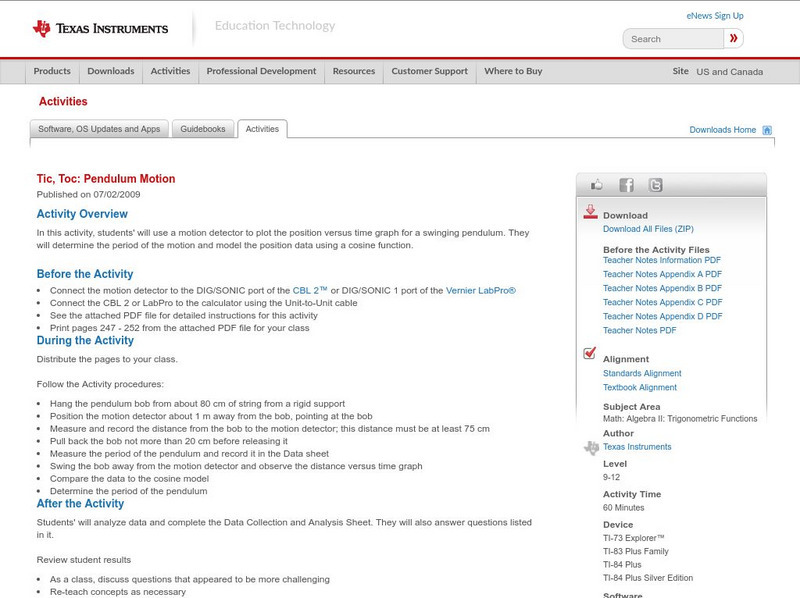
Texas Instruments: Tic, Toc: Pendulum Motion
In this activity, students' will use a motion detector to plot the position versus time graph for a swinging pendulum. They will determine the period of the motion and model the position data using a cosine function.
Texas Instruments
Texas Instruments: Inverse of Two Temps
In this activity, students find a conversion equation that will calculate the corresponding Celsius temperature for any given Fahrenheit temperature. Students learn to graph scatter plots, analyze and graph linear equations, compute and...
Khan Academy
Khan Academy: Estimating Slope of Line of Best Fit
Given a scatter plot, can you estimate the slope of the line of best fit that goes through the data points? Students receive immediate feedback and have the opportunity to try questions repeatedly, watch a video, or receive hints.
Texas Instruments
Texas Instruments: Forensics Case 9: Killer Cup of Coffee: Using Colorimetry
In this activity, Students can use colorimetry to determine the concentration of a colored species in a solution and use a linear relationship to model Beer's law. They use Beer's law to determine the concentration of...
Khan Academy
Khan Academy: Fitting Quadratic and Exponential Functions to Scatter Plots
Determine if a quadratic or exponential model fits a data set better, then use the model to make a prediction. Students receive immediate feedback and have the opportunity to try questions repeatedly, watch a video or receive hints.
TeachEngineering
Teach Engineering: Forces and Graphing
This activity can be used to explore forces acting on an object, to practice graphing experimental data, and/or to introduce the algebra concepts of slope and intercept of a line. A wooden 2x4 beam is set on top of two scales. Students...
Richland Community College
Richland Community College: Math 116 Lecture Notes
This site from the Richland Community College provides the detailed lecture notes to a college algebra course, complete with equations and definitions. Content ranges from "functions and their graphs" to "conics and parametric equations."
CK-12 Foundation
Ck 12: Algebra: Determining the Equation of a Line
This comprehensive study guide highlights the main terms and formulas needed to determine the equation of a line. Examples are included.

