It's About Time
Run and Jump
Has your class wondered how fast a human could run or how high they are capable of jumping? Help them understand these concepts as they explore acceleration and use an accelerometer to make semiquantitative measurements of acceleration...
NASA
Egg Drop Lander
You have to crack a few eggs to make a good engineer! Working in small groups, young scholars design, build, and test devices that protect an egg from breaking when dropped from a ladder.
Teach Engineering
The Great Gravity Escape
Groups simulate an orbit using a piece of string and a water balloon. Individuals spin in a circular path and calculate the balloon's velocity when the clothes pin can no longer hold onto the balloon.
National Council of Teachers of Mathematics
Varying Motion
For this secondary mathematics learning exercise, high schoolers collect data based on a person’s motion. From this data, students create graphs comparing displacement, velocity, and acceleration to time. The five-page learning exercise...
TeachEngineering
Teach Engineering: Projectile Motion
Students are introduced to the concept of projectile motion, of which they are often familiar from life experiences,such as playing sports such as basketball or baseball, even though they may not understand the physics involved. Students...
Science Buddies
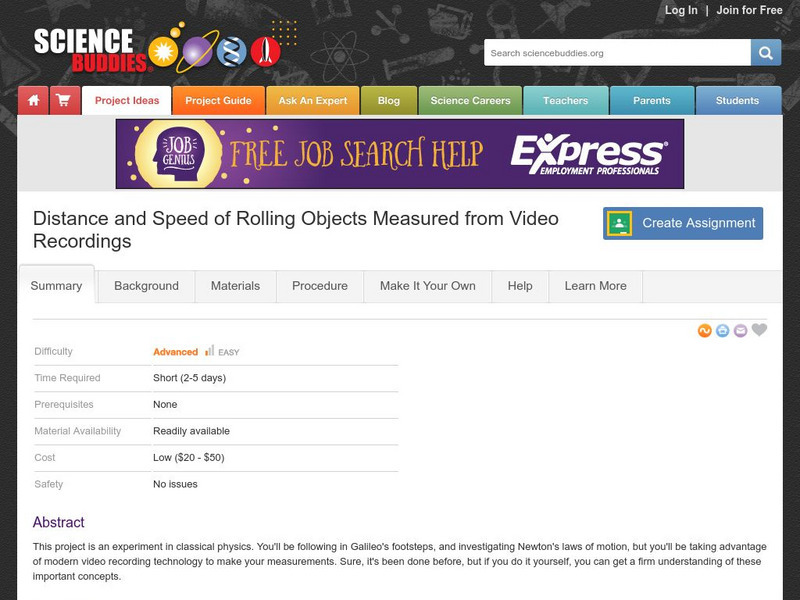
Science Buddies: Distance and Speed of Rolling Objects
This project is an experiment in classical physics. You'll be following in Galileo's footsteps, and investigating Newton's laws of motion, but you'll be taking advantage of modern video recording technology to make your measurements. The...
Physics Aviary
Physics Aviary: Practice Problems: Speed of Horizontal Projectile
Students must determine the horizontal speed of a projectile based on the distance that it travels and other given information. Students must find the time of flight and put it in milliseconds. Finally, students must find the final...
Texas Instruments
Texas Instruments: What's Your Speed?
In this activity, students' will use a motion detector to determine what effect the speed at which a person moves has on the appearance of the distance versus time plot.
Science Buddies
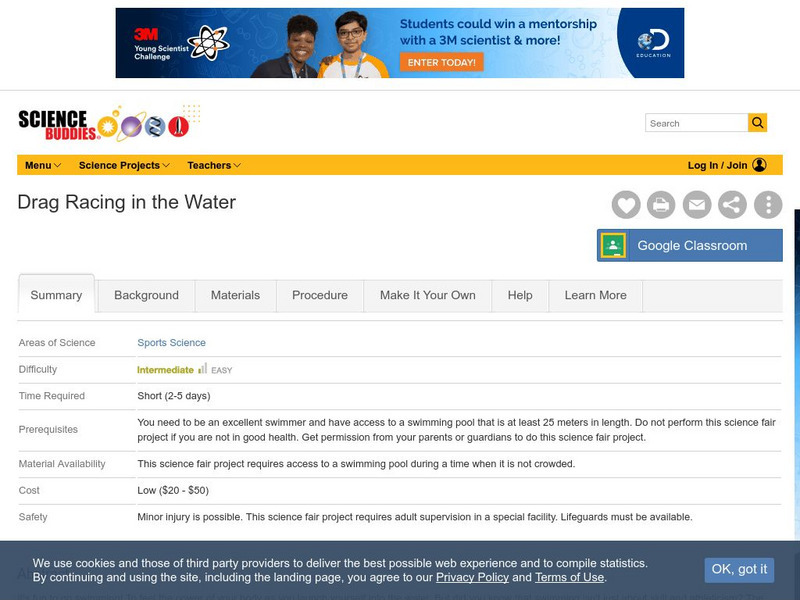
Science Buddies: Drag Racing in the Water
It's fun to go swimming. To feel the power of your body as you launch yourself into the water. But did you know that swimming isn't just about skill and athleticism? The human body consists of skin, contours, and curves. How the water...
Texas Instruments
Texas Instruments: Slow Down: Speed Up
In this activity, students' will use a motion detector to observe the effect of speeding up, slowing down, and moving at a constant rate on a Distance versus Time plot.
Texas Instruments
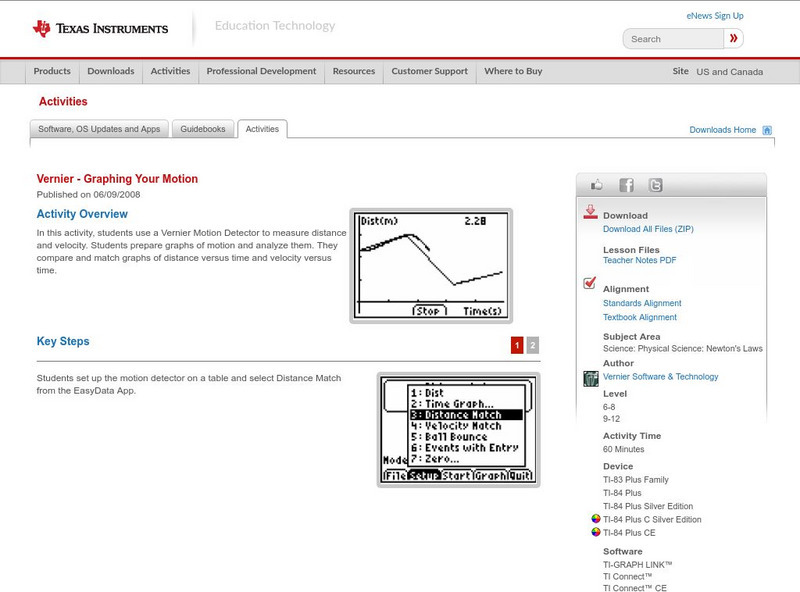
Texas Instruments: Graphing Your Motion
In this activity, students use a Motion Detector to measure distance and velocity. Students prepare graphs of motion and analyze them. They compare and match graphs of distance versus time and velocity versus time.
Texas Instruments
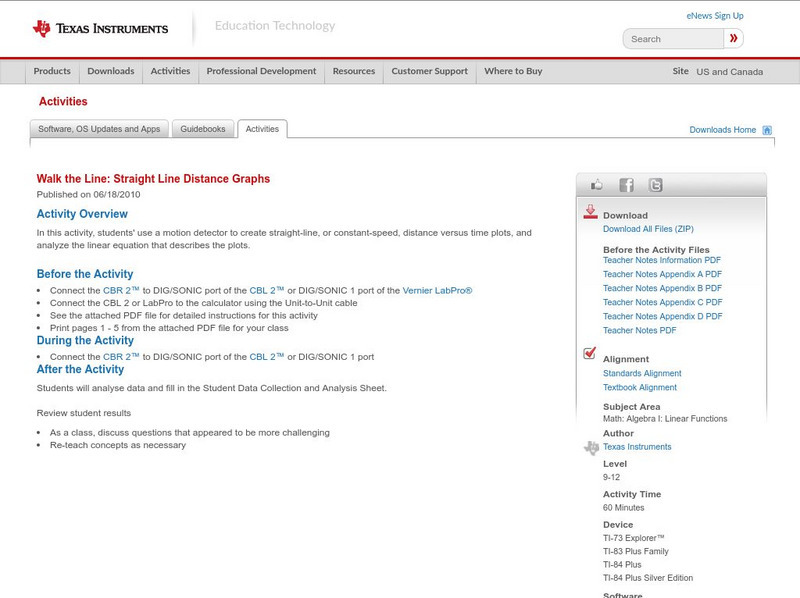
Texas Instruments: Walk the Line: Straight Line Distance Graphs
In this activity, students' use a motion detector to create straight-line, or constant-speed, distance versus time plots, and analyze the linear equation that describes the plots.
Texas Instruments
Texas Instruments: Match Me!
In this activity, students move in a specific way in front of the motion detector to create motion plots that match a given Distance versus Time plot. They make connections between types of movements and characteristics of Distance-Time...
Middle School Science
Middle School Science: Balloon Powered Race Cars
An idea developed by a physical science teacher who applied Newton's Laws of Motion in creating a balloon powered race car. Find simple objective, materials, rules, and procedures.
Texas Instruments
Texas Instruments: Shape Up!
In this activity, students can use the motion detector to record motion, and observe how the direction of movement, speed of travel, and the rate of change of direction and speed affect the shape of a distance-time plot.
Texas Instruments
Texas Instruments: Falling Down Adventure 5
Students use the CBR 2 to study how a change in mass affects the average speed of a falling object. They graph distance as a function of time, and interpret and analyze graphs representing motion.
Texas Instruments
Texas Instruments: A Steep Hike Adventure 3
Students use the CBR 2 to gather distance and time data for various walking speeds. They observe the effect of change in direction and speed of motion on distance versus time graphs. Students interpret and analyze graphs, calculate slope...


